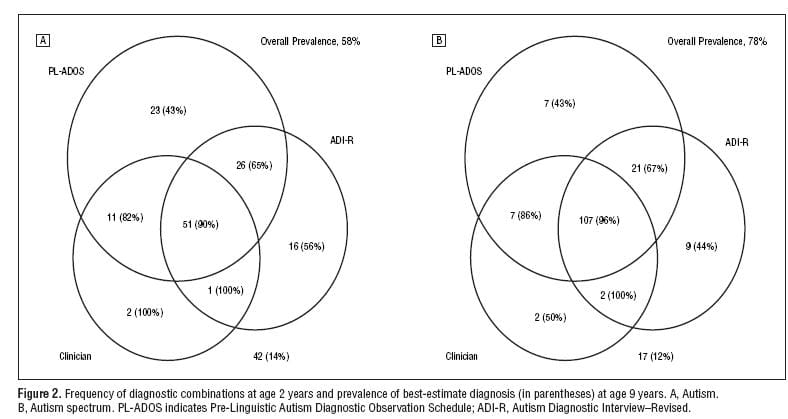
By Kaiser Fung in venn diagram — 26 Sep 2007 A challenge The Gelman blog has issued a challenge on how to present the following Venn diagram in a more comprehensible way. This one is pretty tough.Antony Unwin sent in this entry:Do you have other ideas?