A testing mess across the pond
Kaiser takes a glance at the A-Levels controversy in the U.K.
Controversy has engulfed the A-Level examinations in the U.K. The A-Levels are university entrance level exams of subjects (math, English literature, history, economics, computer science, etc.). Universities conditionally admit students with minimum grade requirements for relevant subjects. The A-Level results are often the most important admissions criterion, by far. Their closest American cousins are the SAT Subject Tests, although in the U.S., these tests are not widely required, and no college conditions admissions on test scores.
The coronavirus pandemic threw a wench into the exams system. Students could not sit for these exams in 2020 thus the authorities concocted a statistical scoring model to assign grades. The model predicts what grade the student would have scored had s/he sat for the exam.
Roughly speaking, each grade has three components: a baseline score that applies to every student, a school factor that applies to all students of the same school, and an individual factor that applies to each student within the same school. The school factor is based on performance of past cohorts of students in the A-Levels. The individual factor is based on the student's prior performance in other public examinations, and on a teacher evaluation.
As part of this exercise, teachers are asked to grade their own students, which have been described by students as their "predicted grades". On results day, a lot of students and their teachers were disappointed by the assigned grades. They found that the model's predicted grades are lower than their teachers' predicted grades. There was a huge outcry about so-called downgrades. The statistical modeling is attacked as "utterly unfair and unfathomable", hurtful to young minds, inconsistent, disappointing, lacking transparency, etc. (See this BBC Live Feed for reactions.)
***
The term "downgrade" interests me a lot. We have two predictions of an unknowable quantity, how the student would have performed had exams not been cancelled. These predictions sometimes don't match.
From the students' perspective, the conditional offers from universities set targets for A-Level grades. Their teachers told them what grades to expect, i.e. the predicted grades. The official grades they receive are evaluated relative to these teacher assessments. If the official grade is lower, it's a "downgrade" and if it's higher, it's an "upgrade".
I believe the exam administrators are shocked by this reaction. They probably regard the teacher assessment as one input in a complex process that generates official grades. They probably see the model's assigned grade as the "truth". It's the teacher assessment that may be over- or under-estimates.
This situation reminds me of my recent post on how the business community interprets metrics about the economy. They take their expectations - potentially generated by models - as the reference level. Official statistics on unemployment, inflation, etc. are evaluated relative to these expecations, rather than the other way round.
***
The media has by and large sided with students and their teachers. In this post, I provide the other side of the story, the challenges faced by the statistical modelers.
There are limited capacity at U.K. universities, and particularly at the more competitive schools. Admissions officers set A-Level grade requirements, the conditional offers, based on historical distribution of grades, and their historical yield rates. If the exams were not cancelled, the administrators are reasonably confident that the grade distribution in 2020 would have been similar to those of recent years.
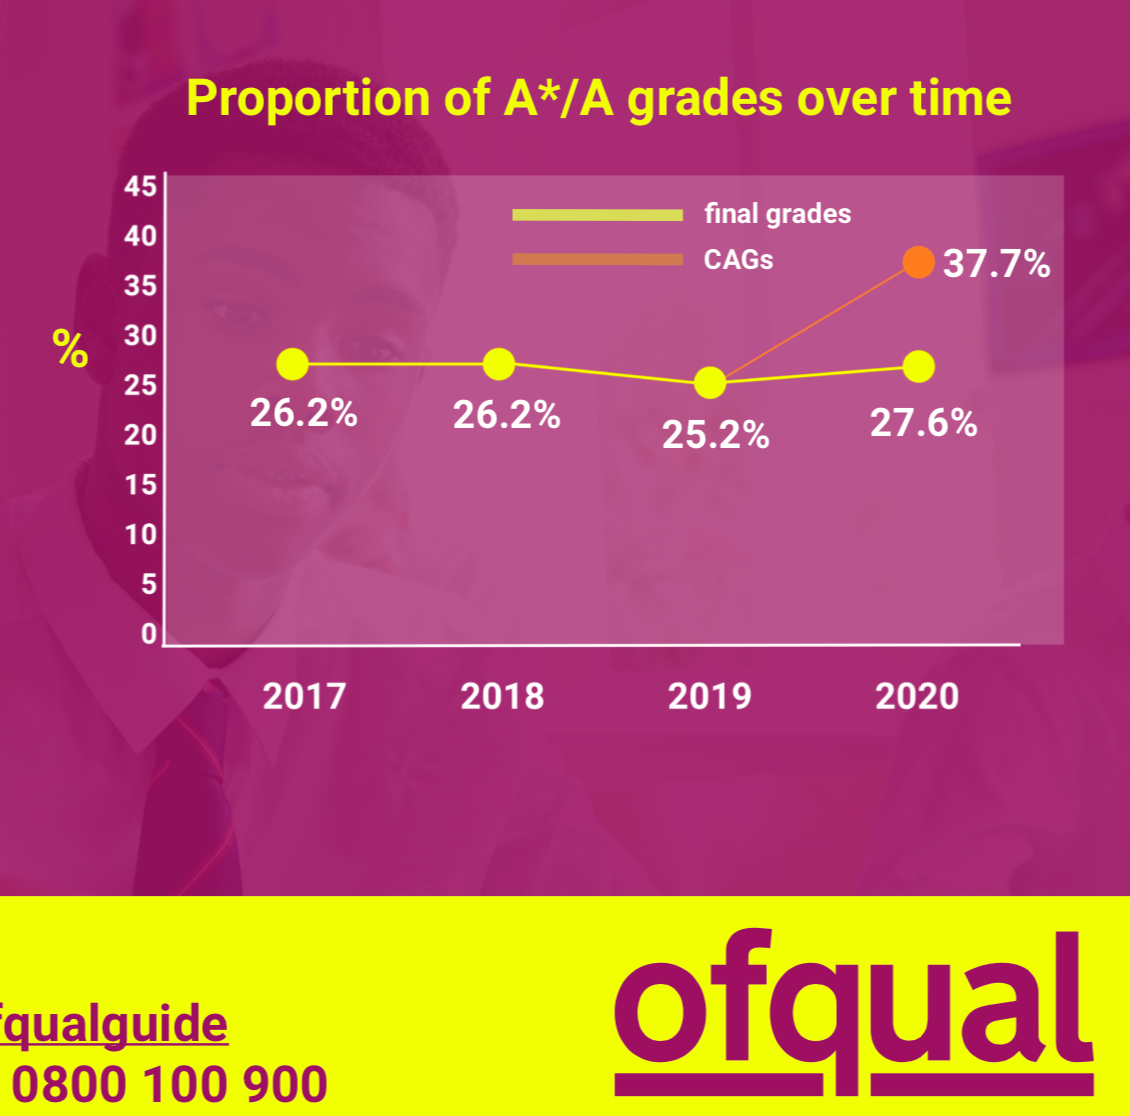
Not surprisingly, the distribution of grade predictions by teachers exhibits grade inflation. The exams authority, Ofqual, published the following chart:

The yellow line represents the proportion of A and A+ grades for the last four years. The orange dot labelled CAGs represents teacher assessments for 2020. Ignoring the 2020 yellow dot for the moment, you see that teachers in aggregate assigned 12.5 percent more A and A+ grades than the 2019 results. As a ratio, this is 50 percent more top grades than the year before!
The so-called downgrading describes the gap between the orange dot (37.7%) and yellow dot (27.6%) in 2020. The teacher assessments were fed to the statistical model which brought the proportion of top grades down to roughly the historical level. In fact, the proportion of top grades issued by the model is 1.4 to 2.4% higher than in recent years.
What this means is the attack on the model is rather misguided. I'm sure there are problems with the model, as with any model, but no model can escape the constraint that the proportion of As and A+s should be about 25 percent. That means all models will issue a lot of "downgrades". They differ by which students are downgraded.
Whoever gets downgraded has a grievance. We haven't heard complaints from those who got upgraded (about 2 percent of grades), and probably won't. Such asymmetric complaints tend to make models worse. Deficiencies are remedied along one dimension but not the other, which introduces a "correction bias" to the model.
I cover this issue in Chapter 2 of Numbers Rule Your World (link) in the context of credit scoring models. When the credit bureaus allow us to check the data, we will challenge anything that might reflect negatively on the credit report, but if the bureau makes a mistake that benefits us, for example, if the report failed to record a prior delinquency event, most of us will not volunteer this information (that will certainly lower our credit score).
***
Another factor that no model can escape is the differential quality of schools. Students of some schools have historically done better at A-Levels and other public exams. It is a bit unfair that a student's grade is partially determined by the quality of the school s/he attends.
In fact, standardized testing solves this problem, except the pandemic wiped that away in 2020. To a large extent, all models assume the future is like the past. Existing inequities and biases get propagated.