Adulterated education
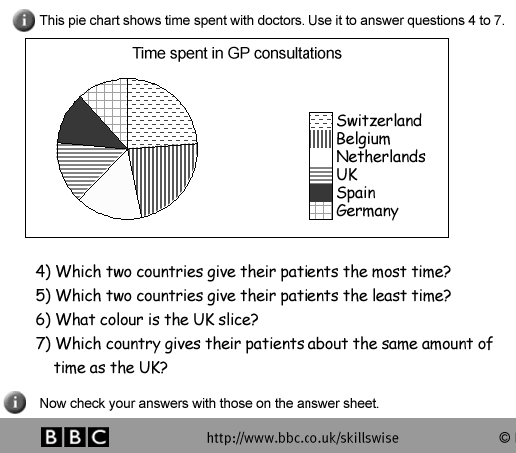
A good teacher makes a great difference. Reader Richard M drove this point home when he sent in a junk chart posing as educational material. The offending graphic is used by BBC's Skillswise website to teach "Handling data: Graphs and Charts". Skillswise is an otherwise laudable effort to help adults "improve their basic skills in reading, writing and maths".

Even for pros, each question is a challenge. Question 7 really requires a new pair of glasses.
The entire worksheet is located here. The use of patterns for shading is especially disconcerting. The graphic also lacks self-sufficiency as we have trouble comparing countries without referencing the underlying data. As we discussed before, a good graphic is one in which graphical objects (bars, pies, dots, etc.) illuminate the underlying data; when all the data must be printed next to the objects, the graphic is most likely redundant.
Source: BBC Skillswise website.


