An offer for New York Times Business reporters
Reading the New York Times's coverage of the unemployment report irritates me so much that I'm putting an offer on the table: if they contact me, I'll send them a copy of Numbersense (link) for free so that they can educate themselves about employment statistics (Chapter 6).
***
In the meantime, let me run through all the irritating errors they keep reporting month after month (link to article). By the way, you will be much better guided if you just read the New York Post column by John Crudele on this stuff.
First of all, the Times insists on reporting the most meaningless metric (the so-called U3 unemployment rate) when the Bureau of Labor Statistics publishes several other much more telling statistics every month. In the first paragraph, they highlighted:
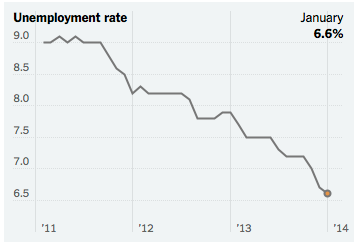
The unemployment rate inched down in January to 6.6 percent, the lowest level since October 2008, from 6.7 percent in December.
The very first chart in the accompanying graphic shows a bold black line that declines from a high of 7.6 percent to the current rate of 6.6 percent. (The online version is even more gung-ho, stretching the timeline back to 2011 when the rate was over 9 percent.)

What's the problem, you ask? The U3 unemployment rate paints an incomplete picture of the nation's jobs market. The chart below shows the other side... the green line, which has in constant decline since 2008, is the proportion of population considered part of the "labor force". It turns out we don't compute unemployment rate off the base of population (or working-age population). There is a convoluted set of rules which define somebody as part of the "labor force" and if you are not in the labor force, you cannot be unemployed!

(I don't usually do dual axis charts. In this one, I just want to quickly show you that these two time series show remarkably different trajectories from the start of 2008.)
Just for example, if you graduate from college, you first become part of the labor force, then if you give up on your job search after several months, you will no longer belong to the labor force (so you can't be unemployed). If you took a part-time temporary job for a day, and never worked another day during the month, you can be considered employed (and part of the labor force). In the book, I explain how to interpret numbers in the light of these complex rules.
Most importantly, prior to the regression recession [Ed: Oops, that was a statistical slip of the tongue], the labor force participation rate (green line) was extremely stable fluctuating around 66 percent but it has been on a one-way slide since 2008 with no end in sight. Currently, it's at 63 percent.
***
Another chart worth printing is the following, which shows an alarming rise in the ratio of U6 unemployment versus U3 unemployment. It paints the picture that the nation's employment situation is not as good as advertised. U6 unemployment is more expansive (but also probably more in line with intuition): for example, a so-called "discouraged worker" is considered unemployed in U6 but not in U3.

This ratio would stay put if U3 and U6 are both moving in lock step. However, it is rising meaning that the rate of decline in U3 is faster than the rate of decline in U6. Another reason why focusing on U3 only is a mistake.
***
Later on in the article, the reporter quotes economists as blaming the "wintry" conditions for the poor jobs report in December. Anyone who makes such a statement is someone who did not do his/her homework. The BLS discloses exactly how they count employment. The most important thing to note is that someone is considered employed if that person has worked at least one hour during the "reference week" of the survey. Working is not defined as going to the office. If you work from home or if you called in sick, you are still considered employed.
The aforementioned economists then said something even more inexplicable, which the reporter duly repeated:
Initially, the weak report for December was blamed on wintry conditions that inhibited hiring, but... a second straight month of disappointing job gains led him to conclude that the cold and snow could not be blamed this time.
Where is the logic in this?
***
The end of the article brings yet another one of the great economic fallacies of our time: the claim that the unemployment problem is due to "only one-third of American work force" having a college degree or higher. This is one of these "Big Data" nonsense referring to the correlation that college grads have much lower unemployment rate than non-college grads.
If this reporter cared to look back at his own headline -- that wage growth has stagnated, and "in fact, white-collar workers did a bit worse than blue-collar workers last year in terms of wage growth", then he might realize that jobs are not chasing college grads these days. If having a college degree would magically find one jobs, then there must be too many jobs requiring college degrees and not enough graduates, and we'd expect our white-collar wages to be rising sharply until that inequilibrium is corrected.
***
This stuff is not that hard. It just requires reading the source materials and understanding the details of how jobs are counted. And I have summarized all of that materials into one book chapter. So please do us a favor and read it!