Bill Gates should hire a statistical advisor
My coworker pointed me to a Huffington Post article claiming a Bill Gates byline that contains some highly dubious analysis and a horrific chart. We presume Gates was fed this information by some analysts but even so, one wishes he wouldn't promote innumeracy. But then, he has a history: Howard Wainer demolished analysis by his foundation used to channel lots of dollars to the "small schools" movement a few years ago; I wrote about that before.
***
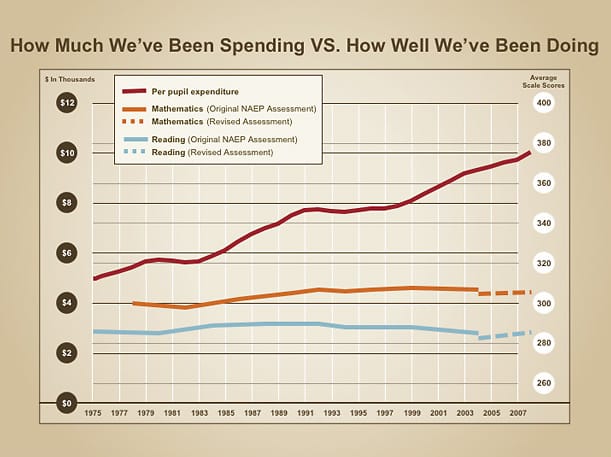
First, the offensive chart:

Using double axes earns justified heckles but using two gridlines is a scandal! A scatter plot is the default for this type of data. (See next section for why this particular set of data is not informative anyway.)
I can't understand the choice of scale for the score axis. The orange line, for instance, seems to have a positive slope. In any case, since these scores are "scaled", and the "standard error" is about 1 (this number is surprisingly hard to find, even on Google), it would appear that between 300 and 400 on the score axis, there are 100 units of standard error. By convention, three units of standard error away from the average is considered rare (events). There is no conceivable way that the average score could jump by that much.
***
The analysis is also flawed. Here's the key paragraph:
Over the last four decades, the per-student cost of running our K-12 schools has more than doubled, while our student achievement has remained flat, and other countries have raced ahead. The same pattern holds for higher education. Spending has climbed, but our percentage of college graduates has dropped compared to other countries... For more than 30 years, spending has risen while performance stayed flat. Now we need to raise performance without spending a lot more.
This argument contains several statistical fallacies:
- Comparing apples and oranges: a glaring piece of missing information is whether other countries have increased their per-student spending on education, and if so, how fast the growth is compared to that in the U.S. Without this, the analysis makes no sense.
- Confusing correlation and causation: so spending increased while test scores stagnated. In order to conclude that there is something wrong with the spending, one must first believe that spending has a causal effect on test scores. Observe that this is not a conclusion from the data; it is an assumption going into the analysis, neither supported nor disputed by the data since the data merely show a (lack of) correlation. This is another instance of "story time": we see data, we see conclusion, we are misled into thinking that data supports conclusion but in fact, the data is an irrelevant distraction. (For other instances of "story time", see this link to my book blog.)
- Fallacy #1 and fallacy#2 combined: even if you believe that spending affects test scores, it is still a stretch to say that spending in U.S. schools affects the gap in test scores between U.S. students and foreign students. In the world where foreign countries are frozen in time, maybe so but where foreign countries are investing in education, one can't say anything about the test score gap without first knowing what's going on overseas.
- Assumption invalidating the analysis: In a short breath, the analyst admits the possibility of (a) spending increase together with flat scores and (b) score increase together with flat spending. One model under which both of those possibilities coexist is one in which test scores are independent of spending. If so, why would one even look at a plot of these two quantities?
- The dilemma of being together (a la Chapter 3 of Numbers Rule Your World): sorry to say but the spending on pupils is likely to have a highly skewed distribution depending on school district. Also, the average test scores is likely to have high variability across school districts. Thus, using an average for the entire country muddies the water.
- Needless to say, test scores are a poor measure of the quality of education, especially in light of the frequent discovery of large-scale coordinated cheating by principals and teachers driven by perverse incentives of the high-stakes testing movement.
In the same article, Gates asserts that quality of teaching is the greatest decisive factor explaining student achievement. Which study proves that we are not told. How one can measure such an intangible quantity as "excellent teaching" we are not told. How student achievement is defined, well, you guessed it, we are not told.
It's great that the Gates Foundation supports investment in education. Apparently they need some statistical expertise so that they don't waste more money on unproductive projects based on innumerate analyses.


