Bubbles of death 2
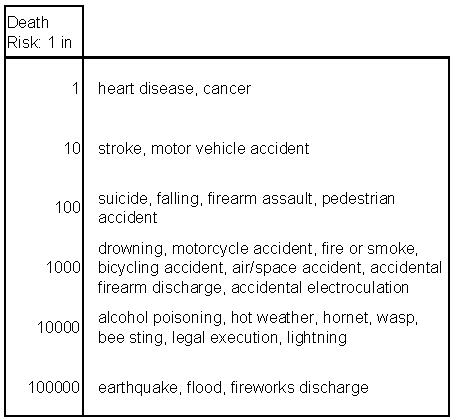
Here is an alternative way to present the death risk data. It's a variation of Tukey's stem-and-leaf plot. Instead of presenting the exact odds, I believe it is sufficient to generalize the data by grouping them into categories. Not much is to be gained by knowing that the odds of dying from fire and smoke is 1 in 1113 as opposed to the odds being in the range 1 in 1000 to 1 in 10,000 and comparable to that of drowning, motorcycle accident, etc.

PS. Be sure to look at Derek's chart in the comments.


