Coffee machine math
Showing the previous setting to the next user is idiotic
In a previous post, I noticed a change in the user interface of the office's coffee machine. Instead of showing default settings, the new interface shows the settings of the previous user so every time, I use it, I see something different. Is this retain-previous strategy better or worse than the common-default strategy?
Previously, I argued that the retain-previous strategy is worse. The main reason is that I don't like the assumption that coffee preferences are serially correlated for people working in the same office. If we take away the serial correlation assumption, then using the most common settings as the default makes more sense. In this post, I attempt to quantify the argument.
Let's set up the stylized problem as follows.
We only have two settings (Large and Small). We assume 70% of users want Large, and 30% want Small. If the machine uses common default, it shows Large to all users, and it would predict correctly 70% of the time. We therefore are interested in whether the retain-previous strategy can be at least 70% accurate.
The retain-previous strategy has to show something to the first-ever user. Let's assume it does the sensible thing, which is to show the most common setting, i.e. Large.
It therefore has a 70% chance of getting the first prediction correct.
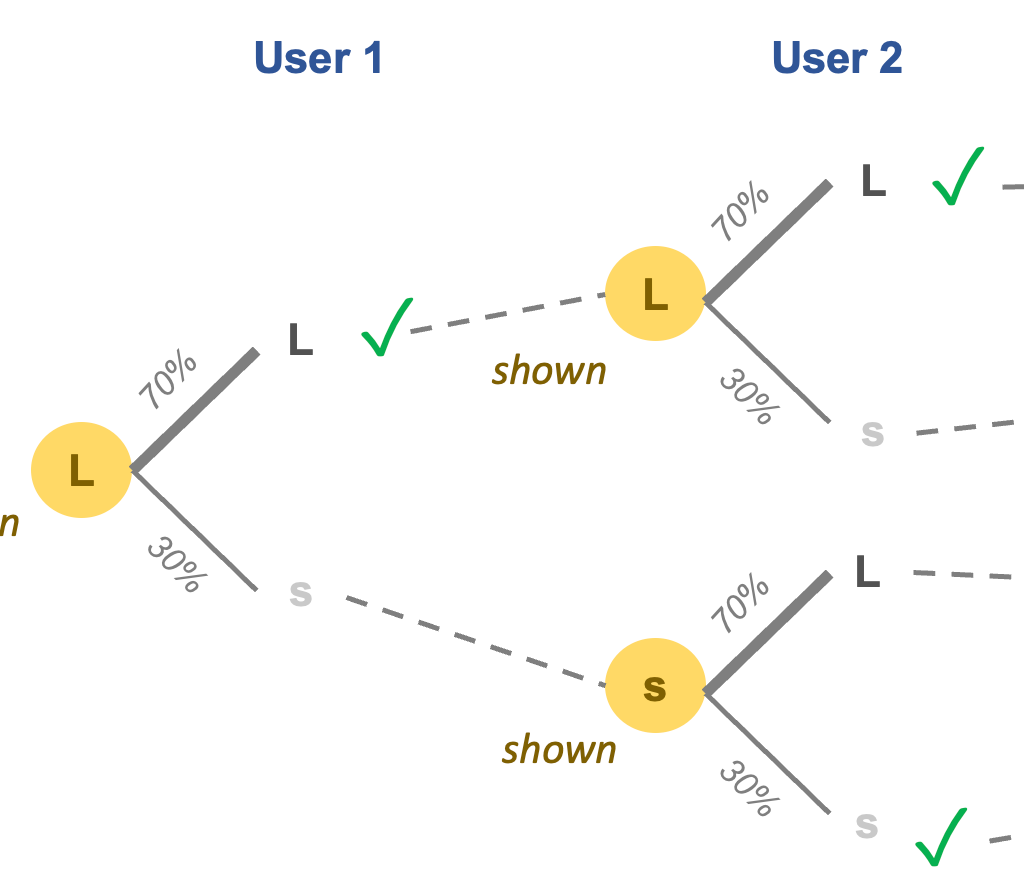
If the prediction is correct, then the first user indeed prefers Large, and the machine shows a Large setting to the second user. If the second user also prefers Large, then the second prediction will also be correct. This has probability $ 70\% \times 70\% = 49\%.$
If the first prediction is wrong, then we know the second user sees a Small setting. In this case, a correct second prediction happens if the second user wants Small. The probability is $ 30\% \times 30\% = 9\%.$
Taken together, the chance that the second prediction is correct is $49\% +9\% = 58\%.$ Notice that already in the second prediction, the correct probability has dipped below 70% (the level of the common-default strategy).
If we roll this analysis over users 3, 4, 5, ...., each of the subsequent predictions will also have a 58% chance of being correct, and this is because the system only remembers one step prior. What the machine shows the third user is not affected by the user type of the first user.
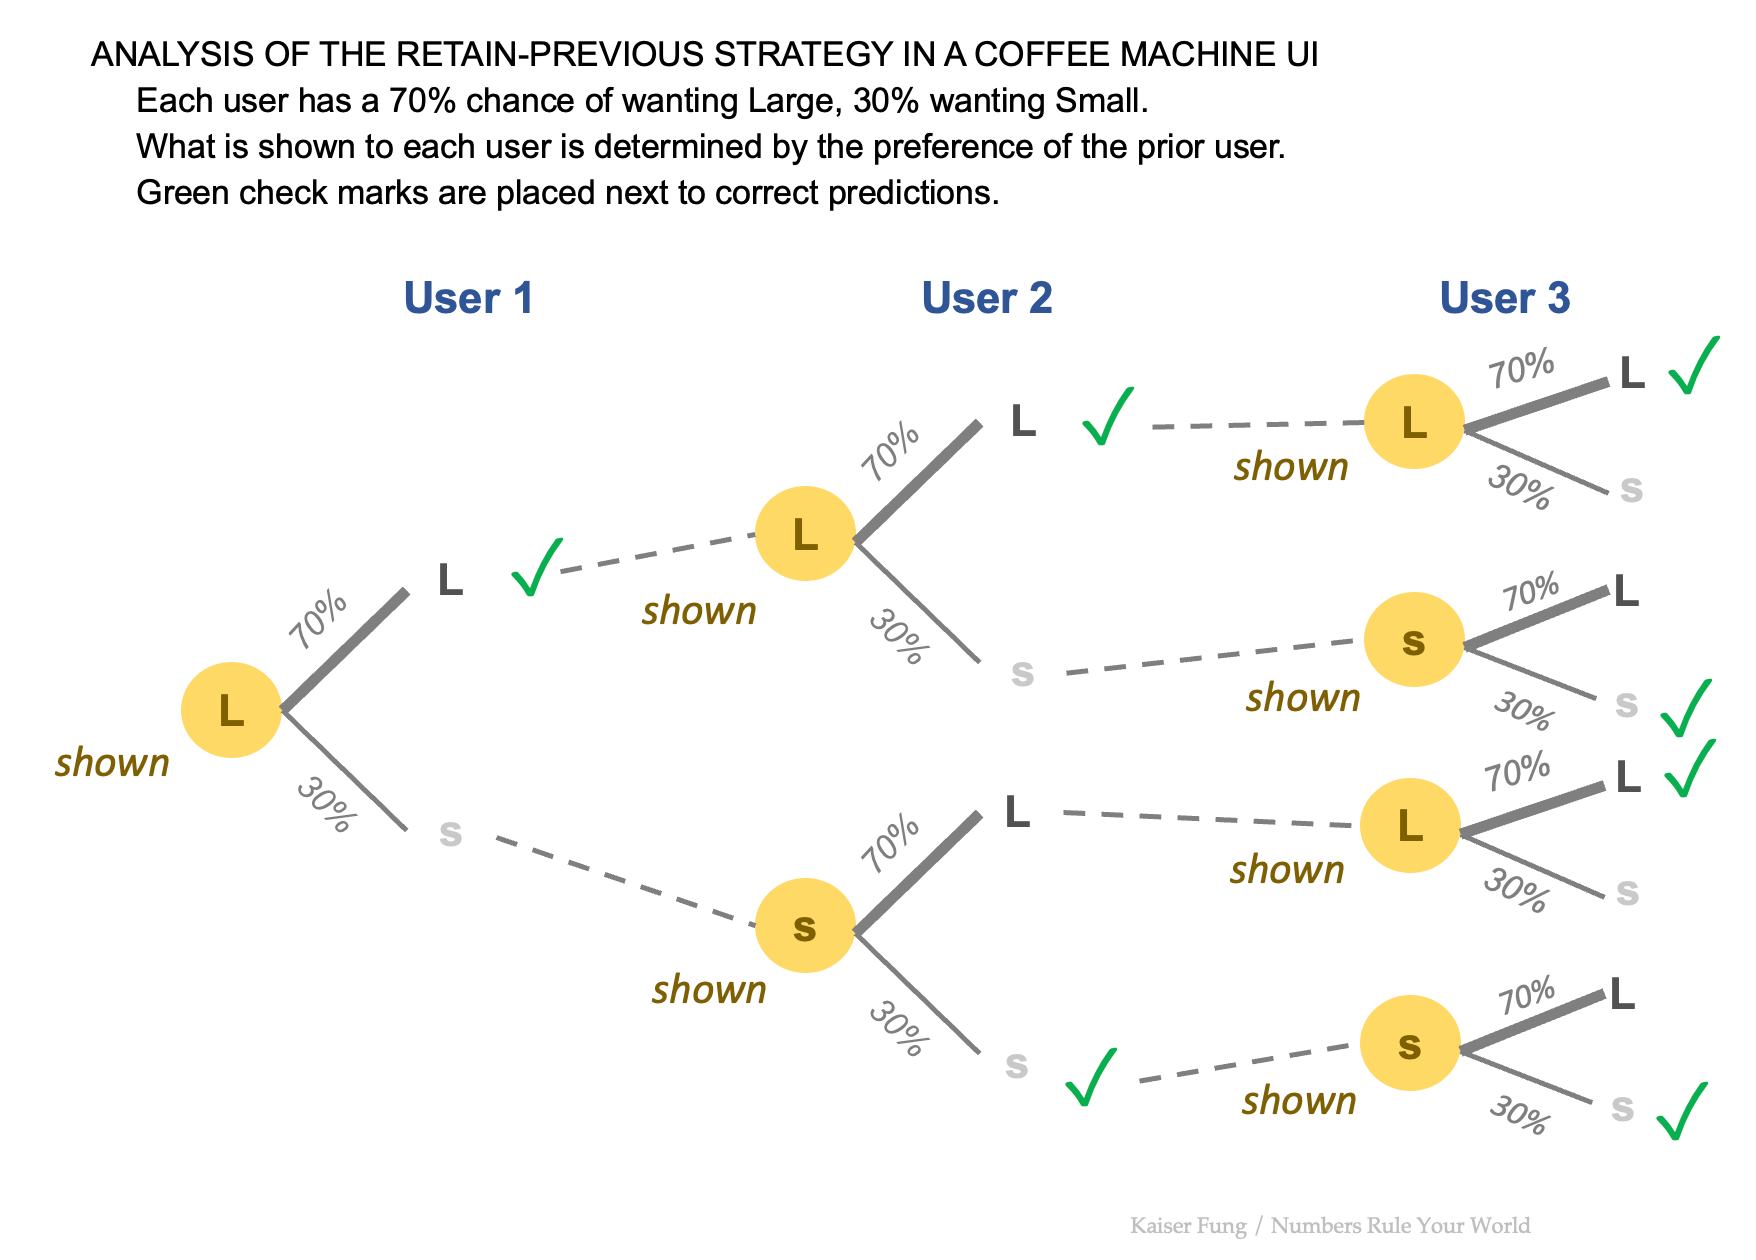
We can check this by looking at the possible sequences up to User 3.
LLL - first user is accurately predicted, second user is shown Large and is accurately predicted, the third user is shown Large also, and is accurately predicted. This has a probability of $70\% \times 70\% \times 70\%.$
LLS - same as above except that the third user is incorrectly predicted, so won't count towards our correct probability.
LSL - first user is accurately predicted, second user is shown Large but prefers Small, third user is shown Small but prefers Large. Two wrong predictions in a row, and won't count towards our correct probability.
LSS - same as above, except that the third user is accurately predicted. This counts toward the correct probability of the third prediction, $70\% \times 30\% \times 30\%.$
SLL - first user is shown Large but prefers Small, the second user is shown Small but prefers Large, the third user is shown Large correctly. The contribution towards the correct probability is $30\% \times 70\% \times 70\%.$
SLS - same as above, except the third prediction errs.
SSL - first user is shown Large but prefers Small, the second user prefers Small and is accurately predicted, the third user is shown Small but prefers Large. No contribution to correct probability either.
SSS - first user is shown Large but prefers Small, the second and third users are both shown Small and they both prefer Small. The addition to the correct probability of the third prediction is $30\% \times 30\% \times 30\%.$
Now, group LLL and SLL. The sum \[70\% \times 70\% \times 70\% + 30\% \times 70\% \times 70\% = 70\% \times 70\%.\] There are two branches out of the first user but ultimately they converge to the same product. Similarly, group LSS and SSS. These two branches converge to the same product, $30\% \times 30\%.$
Thus, the correct probability of the third prediction is $70\% \times 70\% + 30\% \times 30\% = 49\% + 9\% = 58\%.$ Look familiar?
Under this retain-previous strategy, the first prediction is correct 70% of the time, then all subsequent ones are correct 58% of the time. Thus, the overall accuracy must be below 70%, under the level of the common-default strategy.
For those who want to see more equations. The formula for the correct probability is $ p^{2} + (1-p)^{2}, $ where p is the probability of the majority user type. In my example, $ p = 70\%$; substituting that in, the formula gives 58% as I computed above.
As p ranges from 0 to 1, the probability curve is a "bowl" with minimum at $ p = 50\% $, and the value increases as p moves toward 0% or 100%. In other words, the more concentrated the preferences are, the more likely the retain-previous strategy is to make correct predictions. In a sense, the problem becomes easier because most users want the same settings.
The correct probability of the common-default strategy is the proportion of the majority user type, written as $ \max(p, 1-p) $. This curve also has a minimum at $ p = 50\% $, and bends upwards toward 0% or 100%. Instead of a quadratic curve, it is a straight line.
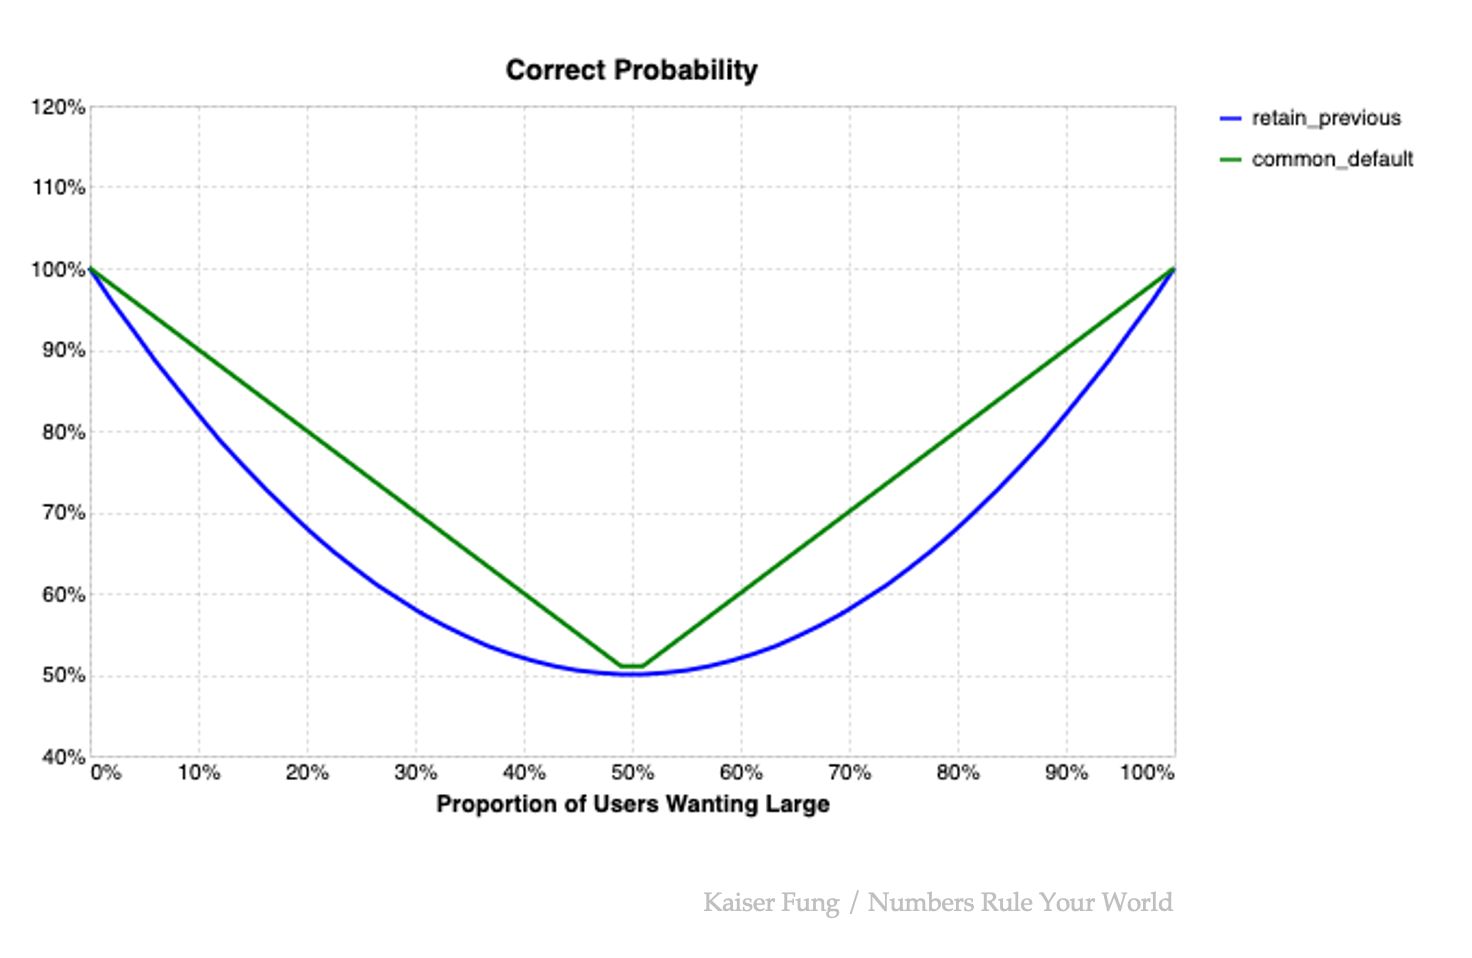
Because the straight line always lies on top of the bowl, the common-default strategy "dominates" the retain-previous strategy. There are three points where the two strategies meet: $ p = 0\% \text{ or } 100\% $, meaning that everybody picks the same settings; and $ p = 50\% $.
In conclusion, while the retain-previous strategy improves in situations where the preferred settings are more concentrated, its predictive accuracy is still below that of the common-default strategy.