Data hunting on the radar (chart)
The data are not where you think they are
Today, I take another look at the simple radar chart created for the previous post in this series.
The most troubling part of this chart form is that it makes us look at things that distort the data, namely the shaded areas, and/or the perimeters.
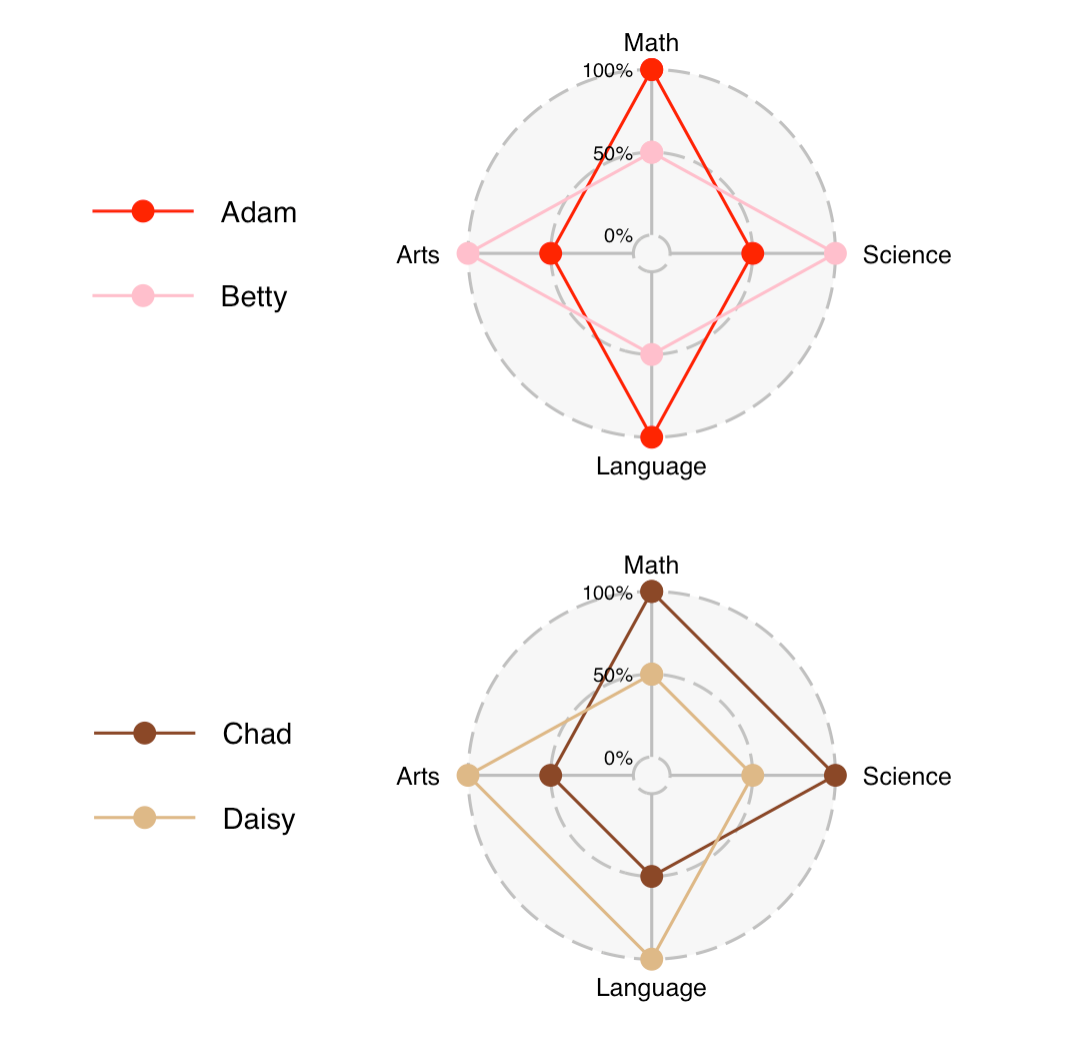
The underlying data of the four students:
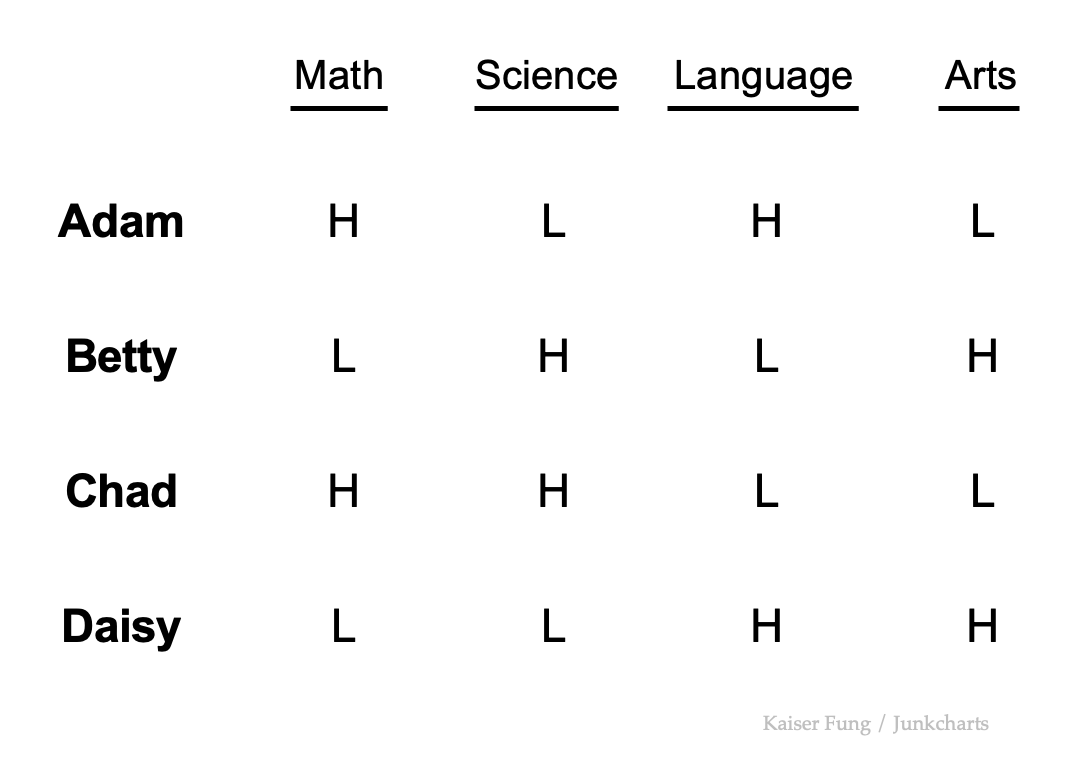
All four students achieved two High and two Low grades in the four subjects, thus they have the same GPA (assuming each subject has the same weight).
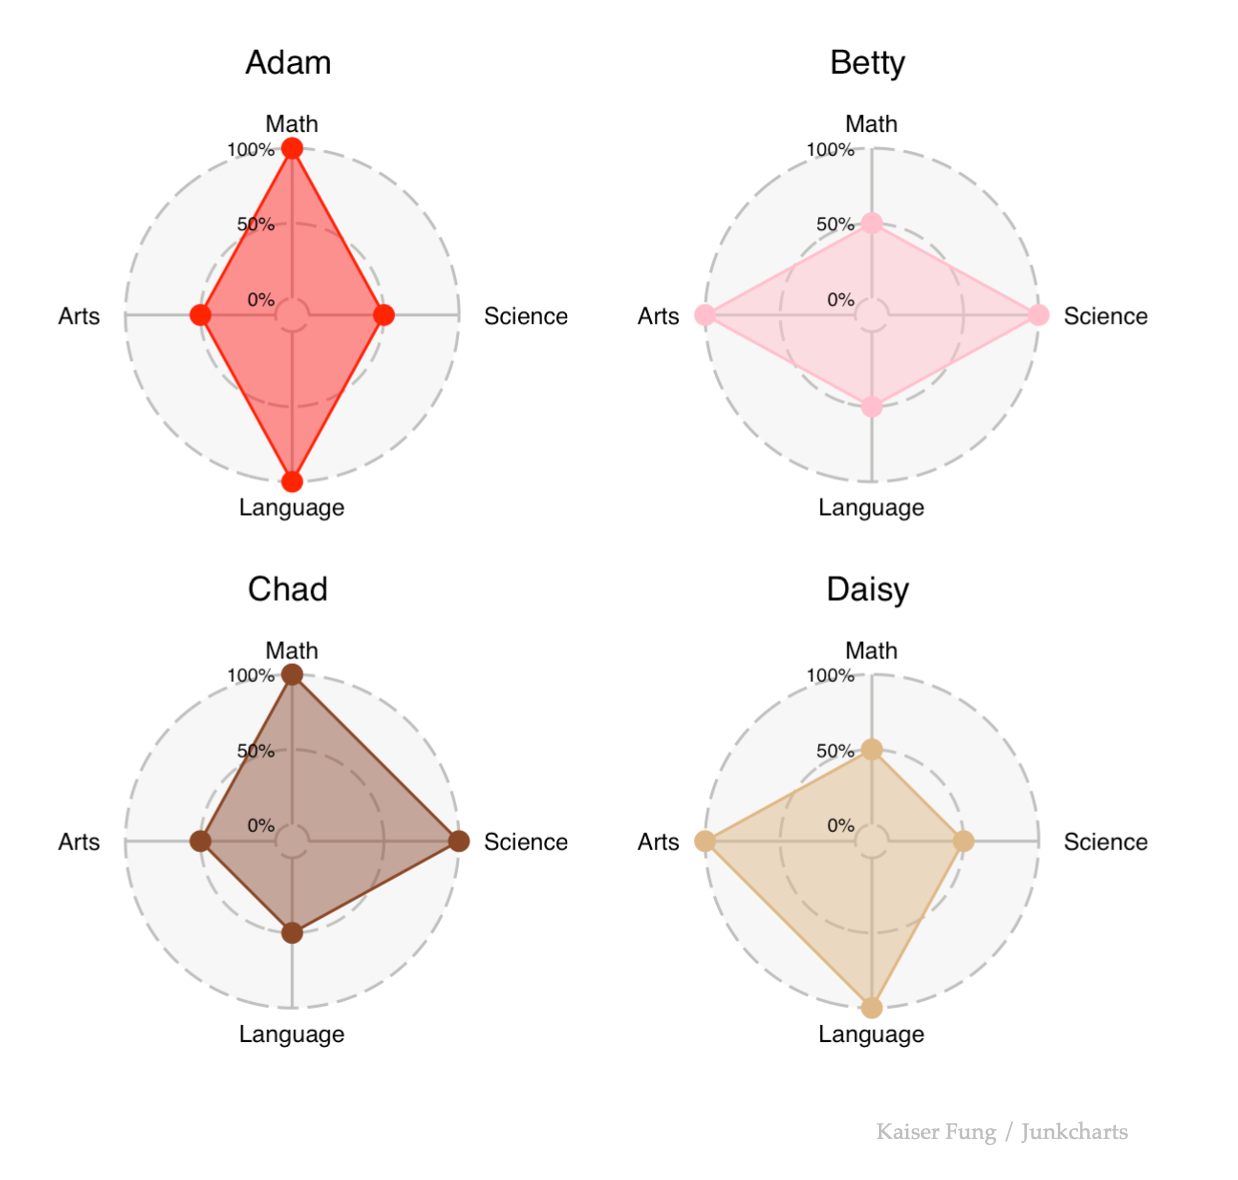
The radar charts divide these students into two sub-groups (top two rows, bottom two rows) if we go by the shaded areas. The area of Adam is the same as that of Betty (by symmetry). Each area is divided into four equal parts, each of which is a right-angled triangle, so the area is 4 x (1/2 x 2 x 1) = 4. (I'm setting the outer radius to be 2 and the inner radius to be 1.) Also by symmetry, the area of Chad is the same as for Daisy. The area of Chad is 13% larger than the area of Adam. We compute Chad's area also by considering four right-angled triangles, so the area is (1/2 x 2 x 1) + (1/2 x 2 x 2) + (1/2 x 1 x 1) + (1/2 x 2 x 1) = 1/2 x (2+4+1+2) = 1/2 x (9) = 4.5.
The only difference between these two sub-groups is which two subjects they achieved the two High grades. To the extent that we claim that the difference in areas represents "data", then the radar chart must have assigned differential weights for the four subjects, in an implicit manner, which defies our understanding.
What this really is saying is the area shown on the radar chart is meaningless.
The perimeter on the radar chart is also meaningless.

To estimate the perimeters, we use Pythagoras's Theorem (square of the hypotenuse is sum of the squares of the two other sides.)
For Adam, the perimeter is 4 x sqrt(4+1) = 4 x sqrt(5) = 8.9. Betty's perimeter is the same as Adam. For Chad, the perimeter is 2 x sqrt(4+1) + sqrt(4+4) + sqrt(1+1) = 2 x sqrt(5) + 3 x sqrt(2) = 8.7. Daisy's perimeter is the same as Chad.
Thus, Chad or Daisy's perimeter is about 2% smaller than Adam or Betty's perimeter. Again, the only explanation for a difference in perimeters is that it encodes a difference in the data, which in this case, represents in which subjects the students achieved their High grades.
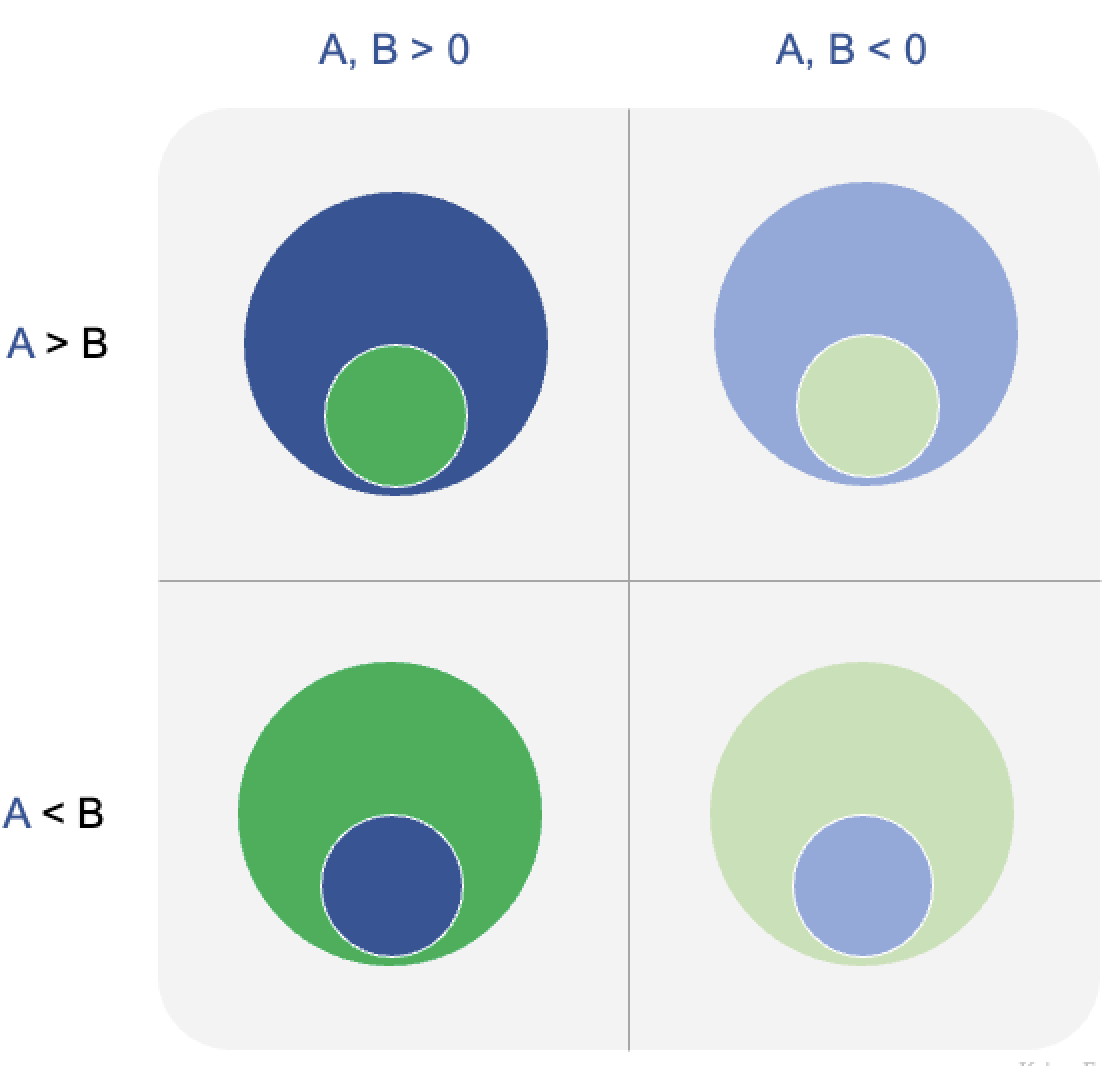
Finally, not only do both area and perimeter distort the underlying data, they stretch in opposite directions!
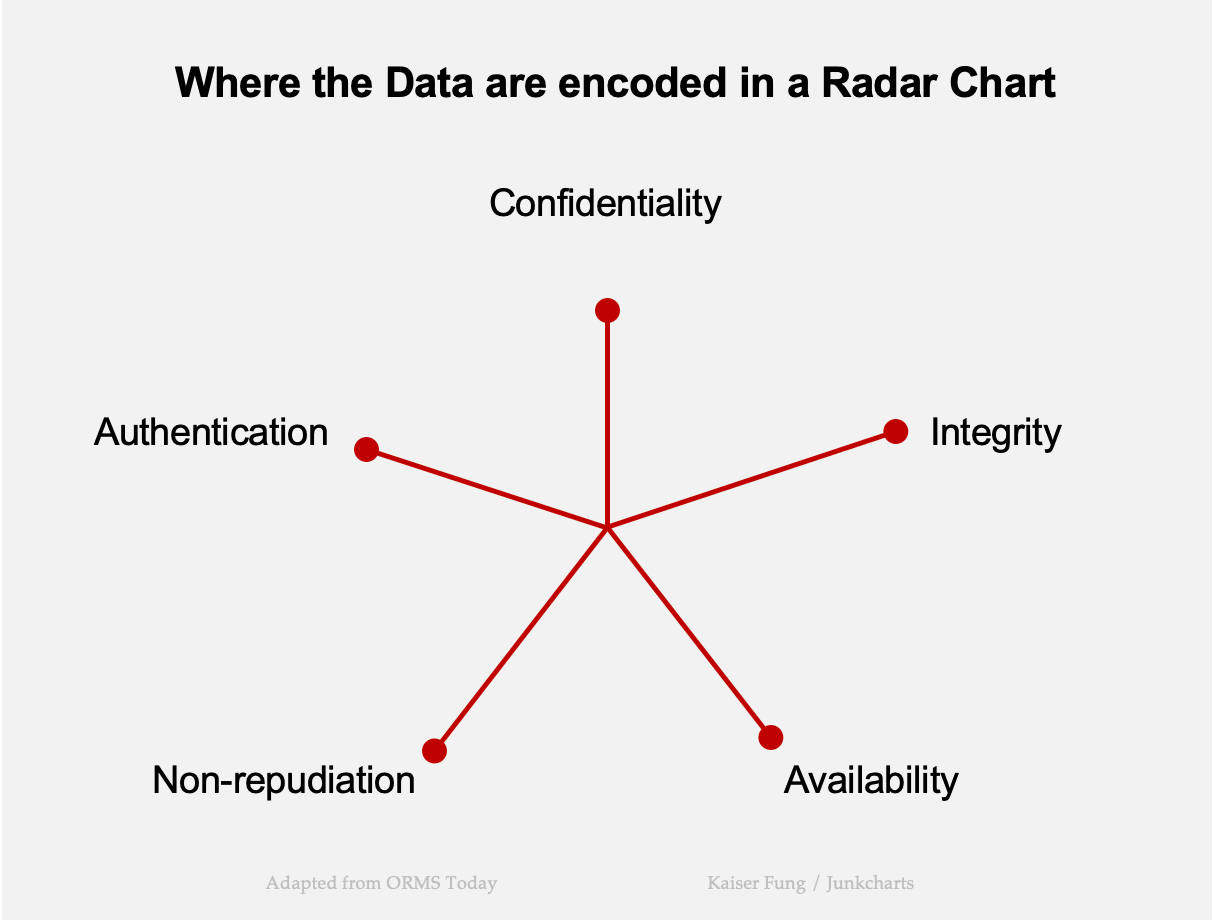
The radar chart doesn't really encode data in the area or the perimeter. The visual form makes us think that. The data are really to be found in the spokes of the chart; here is a chart from the first post of this series.