Energy- and search-efficient
At our recent NYU talk, Dona Wong presented a graphic that her team produced at Wall Street Journal, which expressed in dollar terms the cost of running each appliance in the household. The graphic was a nice picture of a hypothetical house with each appliance labeled with a dollar amount.
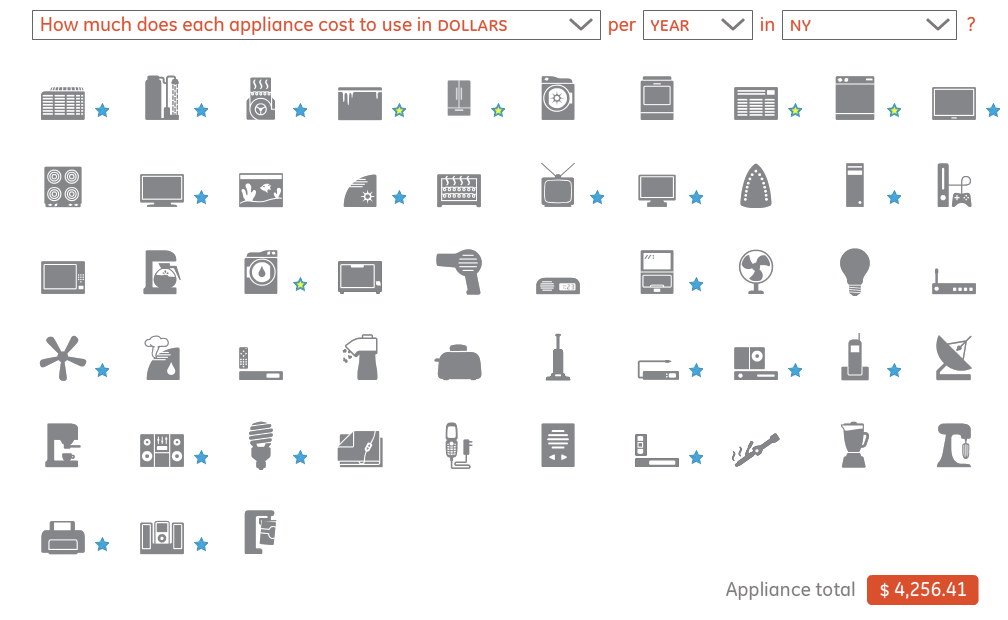
Reader Chris B. complimented the following graphic, found at GE's website, for simplifying the exploratory process to help consumers with energy efficiency information. This is really a kin of what Dona presented.
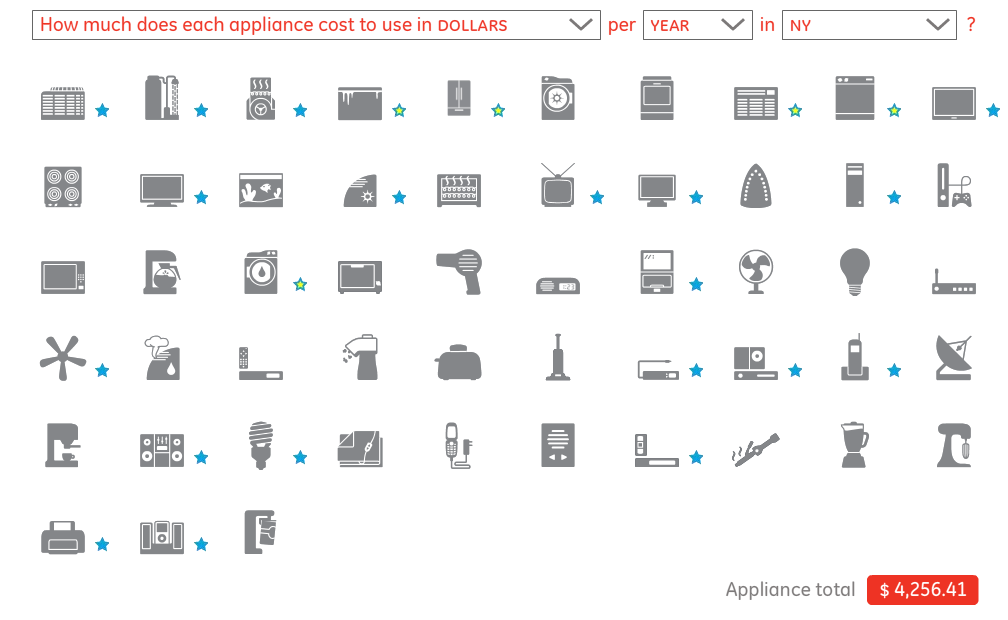
The graphic is interactive. Mousing on the images leads to pop-ups showing the name of the appliance and some information on energy consumption. The appliances are sorted from using most energy to using least energy. The sorting variable can be energy consumed, or cost. The user can choose daily, monthly or annual cost. Also, the cost is tailored to a specific state.
What can be improved?
- With so many appliances being depicted, it would help to provide intelligent clustering. For example, the appliances could be put into natural groups first before sorting, say small kitchen appliances, large kitchen appliances, living room appliances, etc.
- The distribution of cost/energy consumption tends to be heavily skewed so a few lines can be drawn to indicate clusters of appliances with similar characteristics. For the above configuration, the top 5 (central air conditioner, water heater, electric furnace, freezer, refrigerator) have annual costs of more than $300, the next 4 cost between $100 and $200, etc. In particular, a lot of the smaller appliances at the bottom half of the chart cost only $10 annually or less.
- Get rid of the appliance total - or make it interactive such that the user can select a basket of appliances. It is implausible that one's home has exactly one of each of the depicted appliances.
Prof. Latner asked a great question during the NYU talk. What are the underlying assumptions of the data? Any such chart would have assumed some average level of usage of these appliances, average location within a state, etc. The question is really about whether the profile of an "average user" is useful. If there is a lot of variability around the "average user", then statistical avaerages can be meaningless. This is the topic of Chapter 1 of Numbers Rule Your World.


