Enigma of the big-buck pitcher
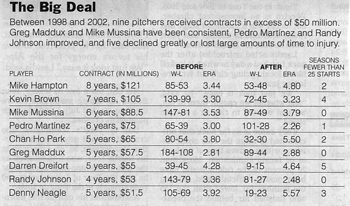
A data table accompanied a recent NYT article pointing out that big-buck pitchers were far from sure wins for those clubs who have taken Scott Boras' pitches. The table contains a wealth of data but very little information is immediately revealed to the reader.

Sorting by size of contract makes no sense, especially since the key metric of success, i.e. change in winning percentage pre- and post-contract, cannot be discerned without pulling out a calculator. Further, once the contract size is expressed by dollars per season, it is clear that all these contracts fall into the same range (about $10-13 million per year).

One graphical alternative is shown on the right. It brings out the desired message, that big-buck pitchers may or may not perform after signing big-buck contracts. Several pitchers are annotated as these have improved or declined by more than 200 points.
A graph cannot hope to achieve the data density of a data table. But the process of making a graph forces the designer to focus on the most important data, which itself has great benefits.
Reference: "Big-buck pitchers are often big busts", New York Times, July 16, 2006.