Further adventures of case-counting windows
Kaiser discusses several observations from the Israel booster study.
If it's not already clear, observational data is a great playground for statisticians. We sniff out where biases are hiding, and we devise methods to correct such biases. It's a lot of fun. It's also frustrating - because there are endless ways to make adjustments.
In today's post, I examine a couple of curious observations made by the Israeli researchers when they analyzed the data from vaccine boosters (link).
***
The researchers shrank the follow-up window when counting severe cases (relative to counting cases)
This decision surprised me because severe cases are a fraction of all cases so I'd want to have a longer counting window, not a shorter one.
Recall that in the analysis of cases, the Israel booster real-world study pulled data from the national database for the month of August. Because of a case-counting window that starts 12 days after the booster shot, in effect, the study only counts cases from August 11 to August 30. Most people did not get the booster on July 31st, and so the average follow-up time is probably around 10 days. (See the previous post for more.)
For severe cases, the case-counting window shrank by 4 days, as the researchers stopped counting on August 26 instead of August 30. Thus, the average follow-up time for severe illness is around 6 days. You're right - protection against severe illness was shown for less than a week.
Here is a direct quote that explains why the case-counting window was shortened for severe cases relative to all cases:
In order to minimize the problem of censoring, the rate of severe illness was calculated on the basis of cases that had been confirmed on or before August 26, 2021. This schedule was adopted to allow for a week of follow-up (until the date when we extracted the data) for determining whether severe illness had developed.
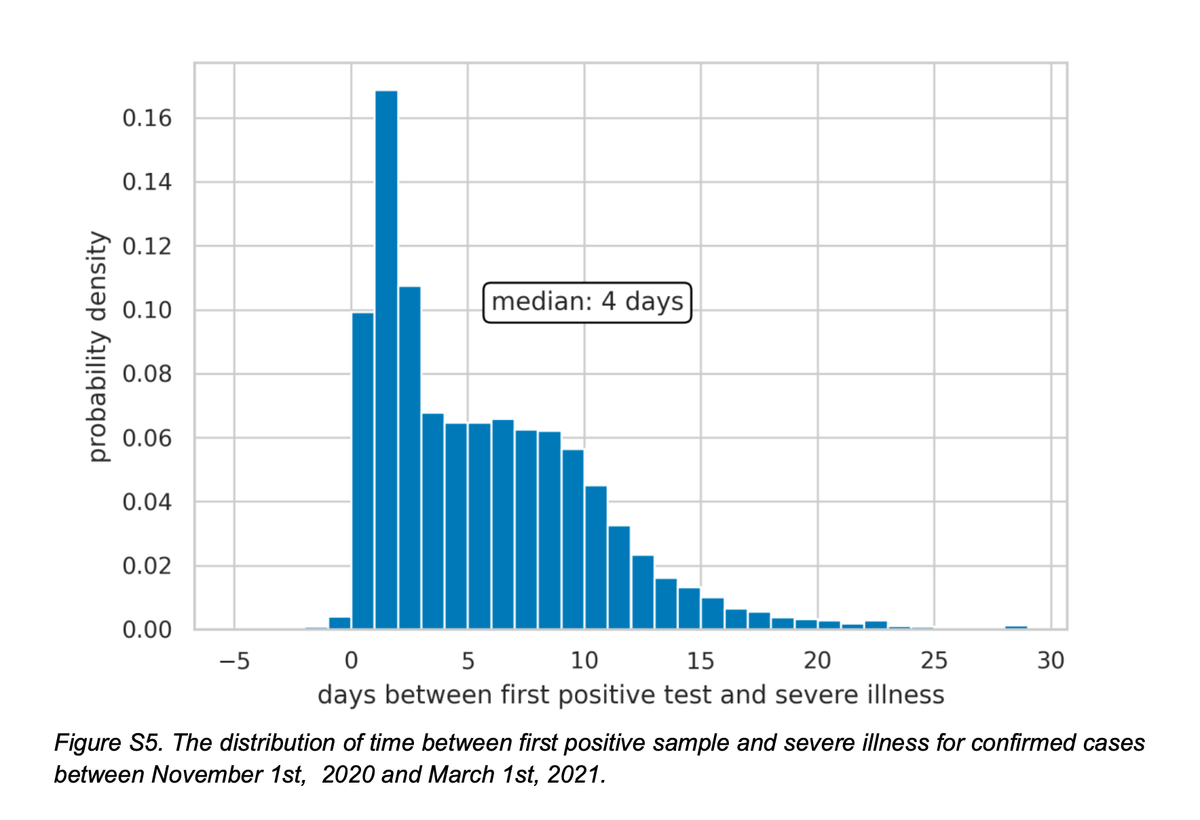
In the Appendix, the researchers offered the following chart as supporting evidence:

This chart shows the lag between testing positive and the onset of severe illness for Covid-19 cases between November and March 2021 (conditional on people subsequently getting severely ill). The median lag is 4 days, meaning among those who eventually got severely ill, half got severely ill within 4 days of testing positive, and half got severely ill after 4 days (up to almost 30 days).
I believe the logic is that for anyone who got sick in the final 4 days of August and became severely ill, the onset of severe illness would have taken place after the data cutoff for this study.
Consider the following implications:
- According to the chart above, half of the past patients took over 4 days and up to 30 days to develop severe illness. If we want to capture all severe cases, we ought to extend the follow-up period to at least 30 days - it should be 60 days if we use a one-month cohort. The methodology based on median lag time would capture only half of the severe cases.
- Think about the severe cases that occurred between Aug 26 and Aug 30. These severe cases are connected with infections that occurred prior to August 26, most likely during August. They are excluded from the analysis. All of these severe cases should count. The severe cases that happened on the first 4 days should be dropped, if we use their logic. (Note that the infection rate was skyrocketing during August.)
- Now think about someone who took the booster shot on August 16. If this person became severely ill on August 26, the severe case is not counted. But this severe case represents a lag time of 10 days from detection of infection, which according to the chart above, happens more than 10% of the time. This issue arises because the case-counting window is given a fixed ending date regardless of when the booster was administered.
***
The researchers disclosed they faced an incurable imbalance problem.
Part of the paper's Appendix is devoted to alternative analyses, one of which is a matching study. I discussed examples of matching studies before (Mayo Clinic, and Clalit). Unfortunately, this disclosure did not contain enough details to evaluate the quality of matching.
The following statement caught my eye: "Due to the very small number of severe cases, and the high censoring proportion, calculation for severe COVID-19 was not possible."
In my comments on the Clalit study (link), I mentioned a limitation of matching studies: if selection bias is severe, it may be hard to find acceptable matches, leading to dropping many unmatched cases ("high censoring proportion"). In this case, the matched population ended up being much younger than the vaccinated population.
In the Israeli booster study, the researchers attempted to find one person who hasn't taken the booster to match with each person who took the booster. Matching variables are the usual suspects like age group, second-dose date and so on. They appear to be saying that they failed to find adequate matches for a large proportion of the booster group. This is a sign of incurable covariate imbalance. This also suggests that those regression adjustments used in the main analysis are insufficient.