Jittering lines
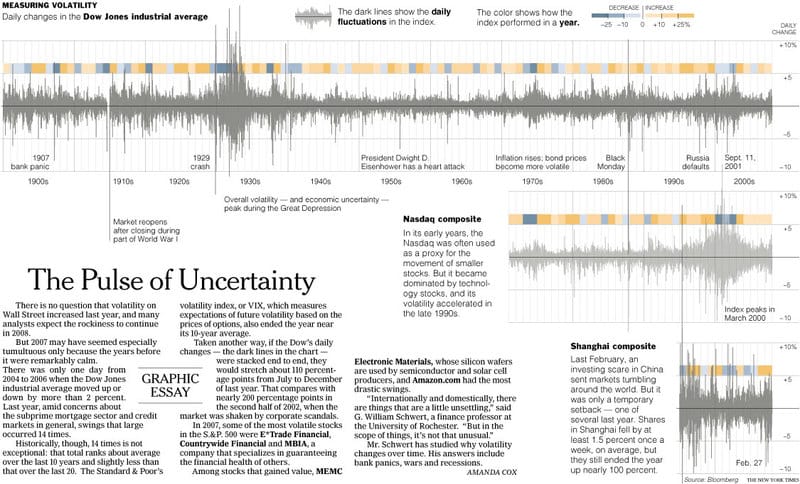
A reader alerted me to this NYT chart a few weeks back. The chart plots daily changes in stock index prices (gray lines) and yearly changes (color blocks).

The blue blocks represent bad down years but notice that the daily changes during many of those periods give no such impression.

In fact, the gray lines are quite equally balanced on both sides of 0, and yet the annual tallies swing from positive to negative quite frequently. It is by no means true that one exceptional down day predicts a down year.
The problem arises from cramming too much data into too small a space. We can't judge the density of the lines on paper and so can't judge whether there were more up lines than down lines.
This issue is not dissimilar to the jittering question when used with large data sets.
Source: "The Pulse of Uncertainty", New York Times, Jan 4 2008.


