Junk Charts
  • About
  • RSS
  • Posts by Year
  • Posts by Keywords
Sign in Subscribe
Working with lines
Axis

Working with lines

Here's how a great idea can be made better. The
Read More
Unscientific poll?
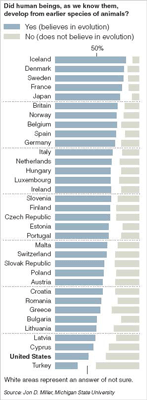
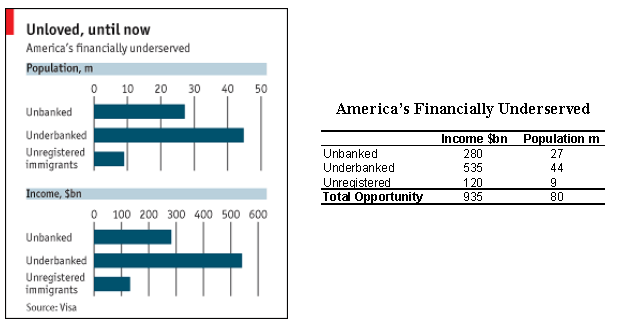
Bar chart

Unscientific poll?

This decent chart adequately brought out a, to some, shocking point that
Read More
Transparent circles
Finance

Transparent circles

Jens from Library House sent us this chart featuring house price to
Read More
Enigma of the big-buck pitcher
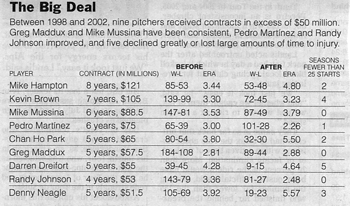
Clustering

Enigma of the big-buck pitcher

A data table accompanied a recent NYT article pointing out that big-buck
Read More
Using data tables
Bar chart

Using data tables

Charts are supposed to elucidate data.  We love charts here but sometimes
Read More
Statistics and liars
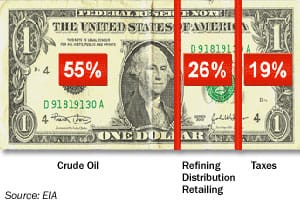
Current affairs

Statistics and liars

(Title: "Where does your gasoline dollar go?") Anyone who picked
Read More
← Newer Posts Page 108 of 109 Older Posts →
Junk Charts © 2026
  • BOOKS
  • COURSES
  • PRESS
  • CONSULTING
  • COACHING
  • CONTACT
Powered by Ghost