Simple presentations
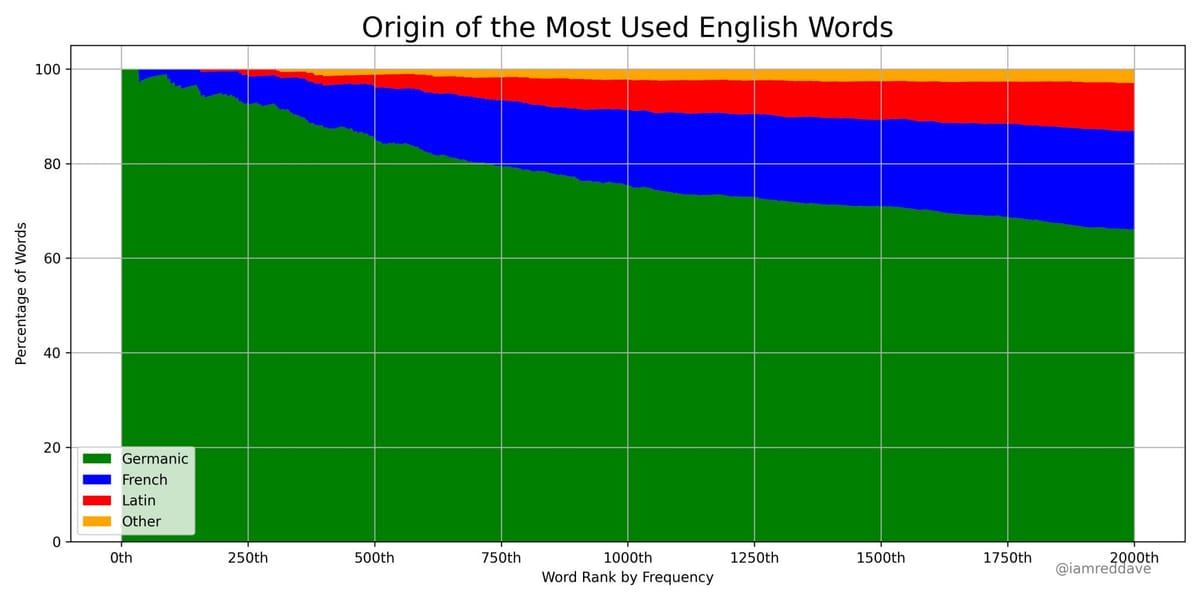
In the previous post, I looked at this chart that shows the distributions of four subgroups found in a dataset:

This chart takes quite some effort to decipher, as does another version I featured.
The key messages appear to be: (i) most English words are of Germanic origin, (ii) the most popular English words are even more skewed towards Germanic origin, (iii) words of French origin started showing up around rank 50, those of Latin origin around rank 250.
***
If we are making a graphic for presentation, we can simplify the visual clutter tremendously by - hmmm - a set of pie charts.

For those allergic to pies, here's a stacked column chart:

Both of these can be thought of as "samples" from the original chart, selected to highlight shifts in the relative proportions.

I also reversed the direction of the horizontal axis as I think the story is better told starting from the whole dataset and honing in on subsets.
P.S. [1/10/2025] A reader who has expertise in this subject also suggested a stacked column chart with reversed axis in a comment, so my recommendation here is confirmed.


