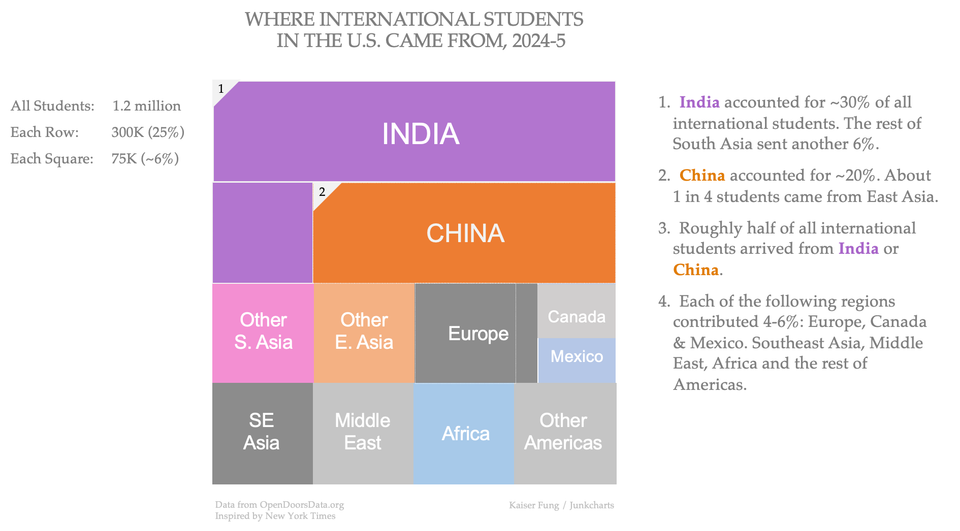
Junk Charts
  • About
  • RSS
Sign in Subscribe

Aggregation

Good models + Bad data = Bad analysis
Aggregation

Good models + Bad data = Bad analysis

Example showing how to diagnose bad data in data science models
Read More
The index of an index is confusion
Index

The index of an index is confusion

The puzzle of negative numbers
Read More
How effective visualization brings data alive
Aggregation

How effective visualization brings data alive

Bringing data alive
Read More
An overused chart, why it fails, and how to fix it
Spider chart

An overused chart, why it fails, and how to fix it

A chart with conceptual appeal but fails the data
Read More
Reality check on the long tail
Aggregation

Reality check on the long tail

Another over-sold story?
Read More
Making charts beautiful without adding unneeded bits
streamgraph

Making charts beautiful without adding unneeded bits

What is the message?
Read More
Junk Charts © 2025
  • BOOKS
  • COURSES
  • PRESS
  • CONSULTING
  • COACHING
  • CONTACT
Powered by Ghost