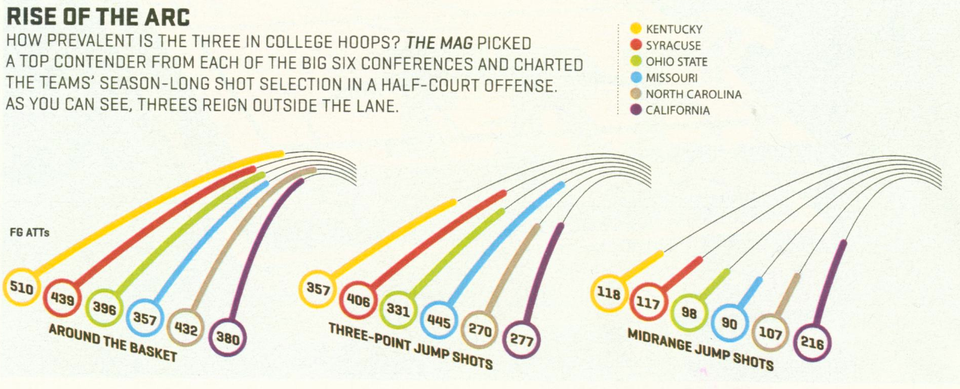
Aggregation Guess which day I made this chart ESPN Magazine issued a special analytics edition to ride the Moneyball bandwagon.
Aggregation Does being underrated have statistical meaning? (I don't have an answer.) While I was reading Eater's article on "NYC'
Aggregation The most anti-statistical statistic, courtesy of Kristof It's a good thing for Alex Tabarrok to draw attention
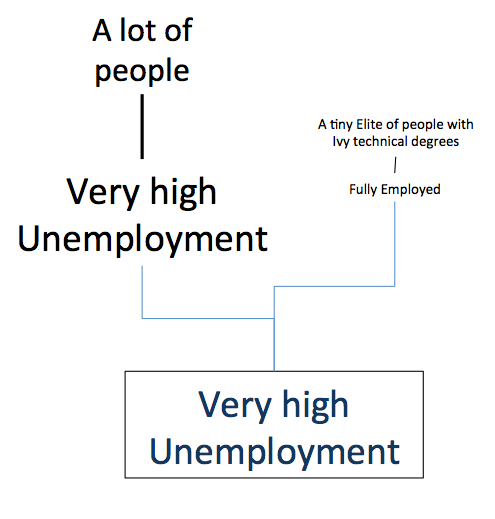
Aggregation Structural unemployment in black and white A popular argument is circulating out there. You may have heard this
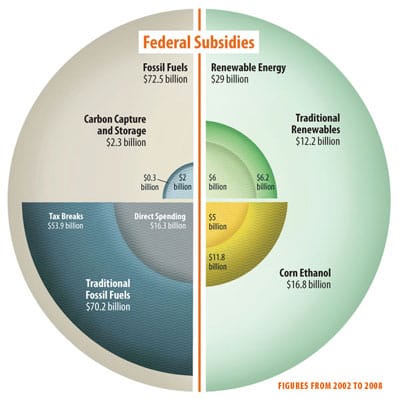
Aggregation Worst statistical graphic nominated Phil, over at the Gelman blog, nominates this jaw-dropping graphic as the
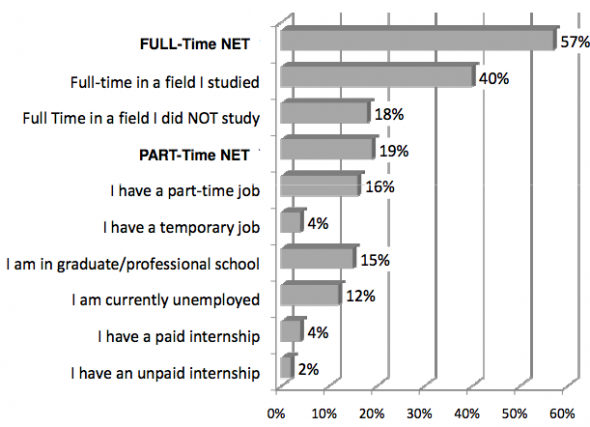
Aggregation Squeezing our kids' salaries and sending them into debt I wondered (in this prior post) why many economists, including Ben Bernanke,