Junk Charts
  • About
  • RSS
  • Posts by Year
  • Posts by Keywords
Sign in Subscribe

Archive: 2008

From bad to worse
Background

From bad to worse

Pie charts can range from bad to worse.  Brent L. pointed us
Read More
Aggregation

Break it down, build it up

Thought of the day: While commuting today, I wondered why we use
Read More
How to read a graph
Blogs

How to read a graph

Via Gelman, here is a nifty book-buying map from Amazon, displaying the
Read More
Mind the gap
Business

Mind the gap

When comparing two time series, one typically wants to discuss the size
Read More
The matter of bad choice
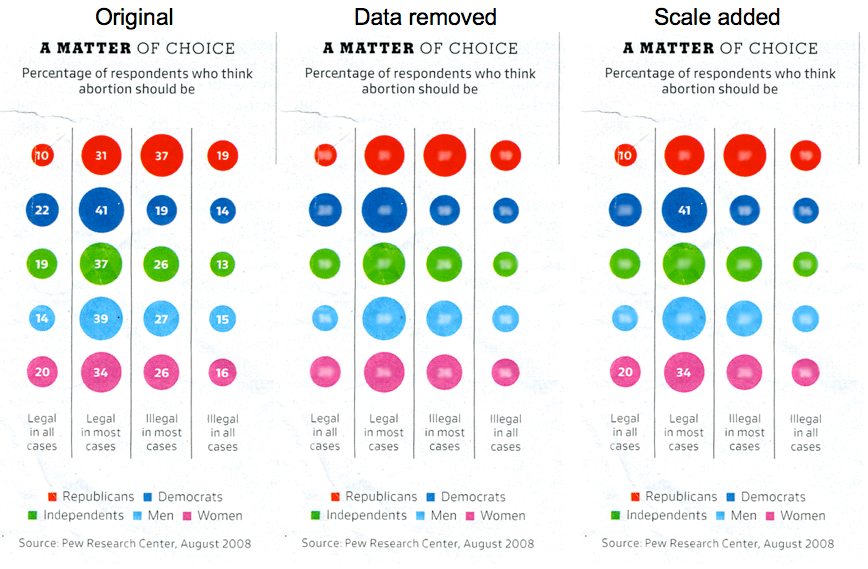
Bubble chart

The matter of bad choice

Right on the heels of the disastrous bubble chart comes another, courtesy
Read More
Dealing with skew
Aggregation

Dealing with skew

Bernard L pointed us to this income distribution chart printed in the
Read More
← Newer Posts Page 8 of 9 Older Posts →
Junk Charts © 2025
  • BOOKS
  • COURSES
  • PRESS
  • CONSULTING
  • COACHING
  • CONTACT
Powered by Ghost