Analytics-business interaction Ethical dilemmas in data science and analytics About half a year ago, when my article on ethics in data
Analytics-business interaction Statistical thinking on my subway commute So I recently moved and needed to find the optimal subway ride
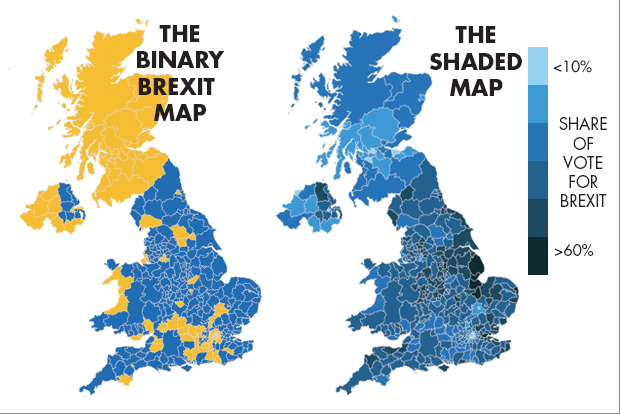
Aggregation Brexit, Bremain, the world did not end so dataviz people can throw shade and color Pick your own distortion
Bar chart Dot plots are under-valued, that's all Bar charts are over-used and over-rated. Just casually, I found this example
Aggregation Depicting imbalance, straying from the standard chart My friend Tonny M. sent me a tip to two pretty nice