Junk Charts
  • About
  • RSS
  • Posts by Year
  • Posts by Keywords
Sign in Subscribe

Axis

Simple presentations
Axis

Simple presentations

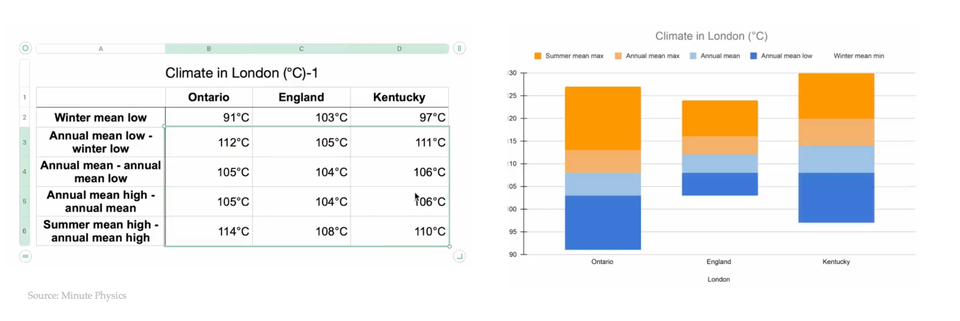
In the previous post, I looked at this chart that shows the
Read More
Five-value summaries of distributions
Boxplot

Five-value summaries of distributions

Using five numbers ot summarize data distributions
Read More
Dot plots with varying dot sizes
Aggregation

Dot plots with varying dot sizes

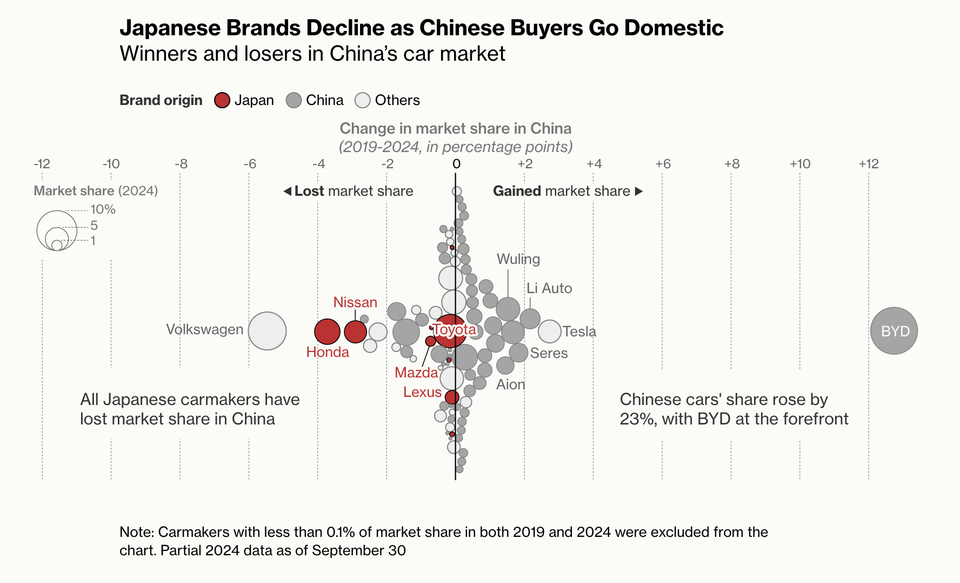
An example of a dot plot with varying dot sizes
Read More
Dizziness
Bar chart

Dizziness

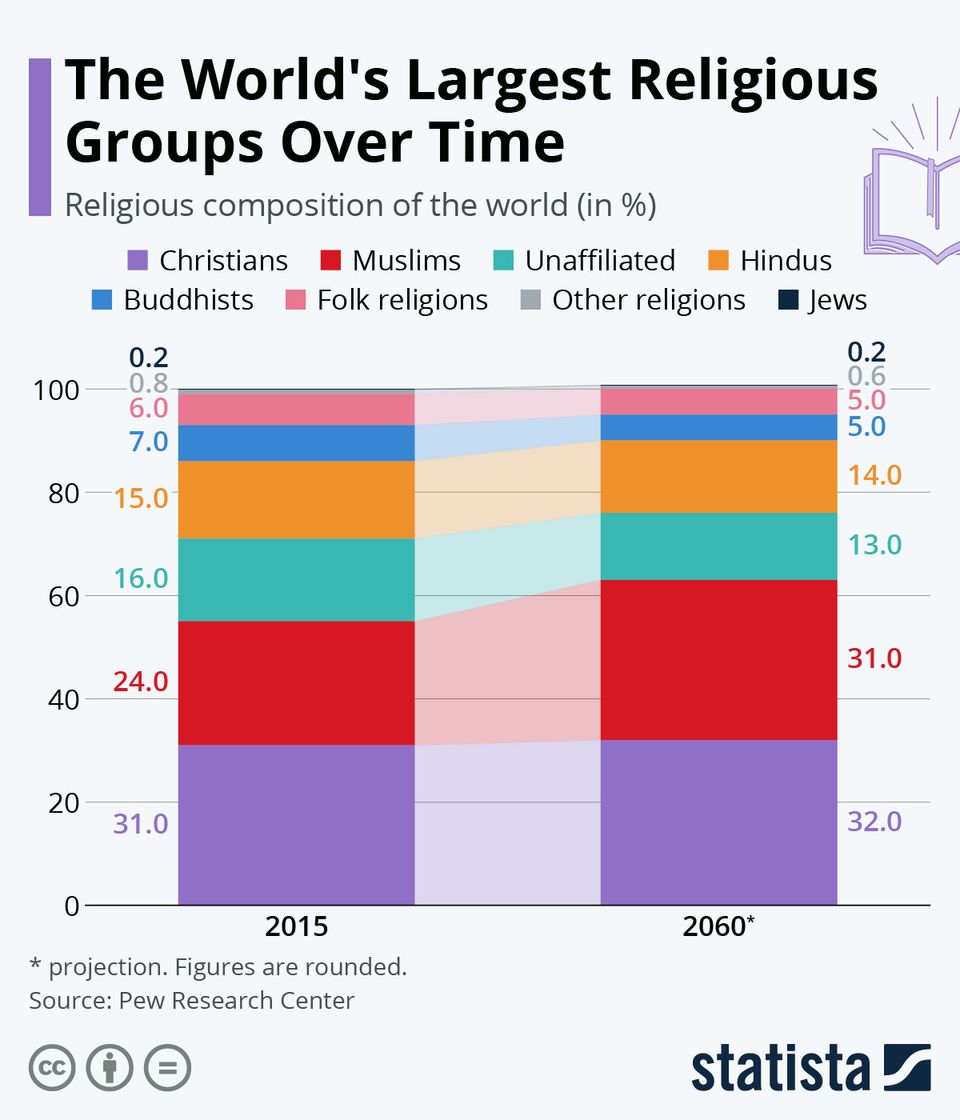
Dizziness is probably not an intended goal of charting
Read More
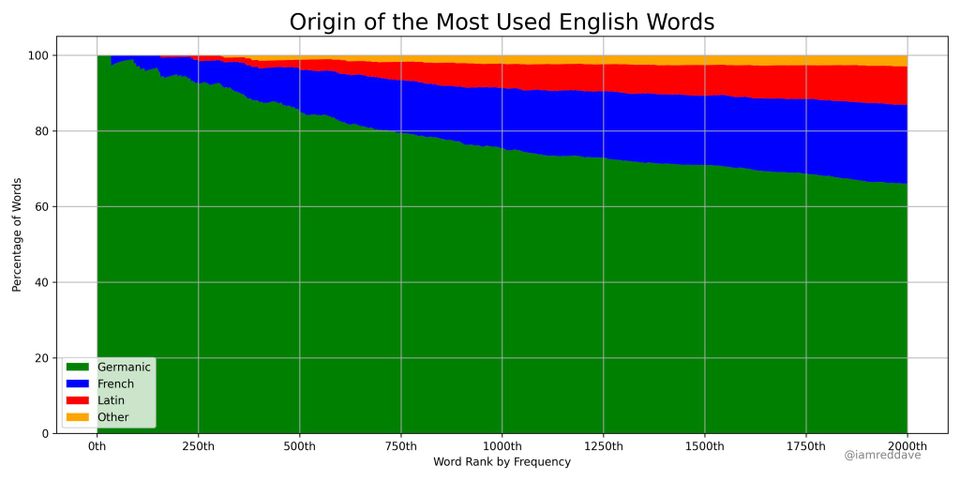
Small tweaks that make big differences
Axis

Small tweaks that make big differences

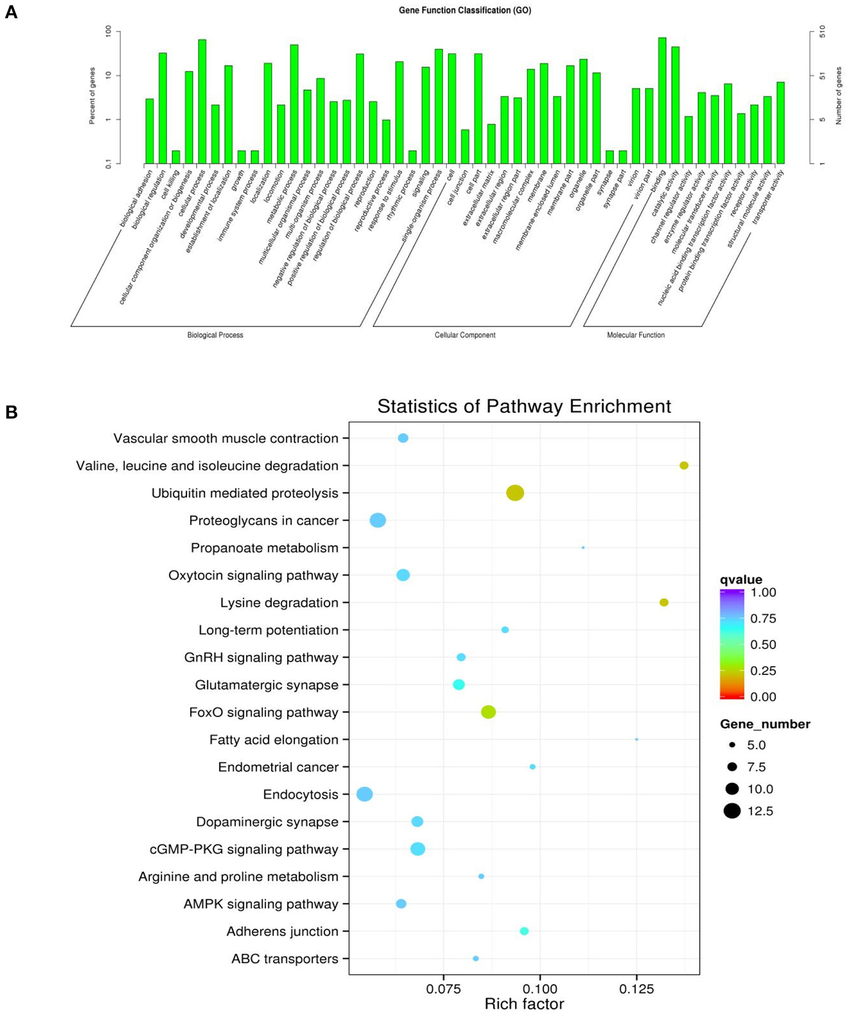
Some small tweaks to data graphics make a huge difference
Read More
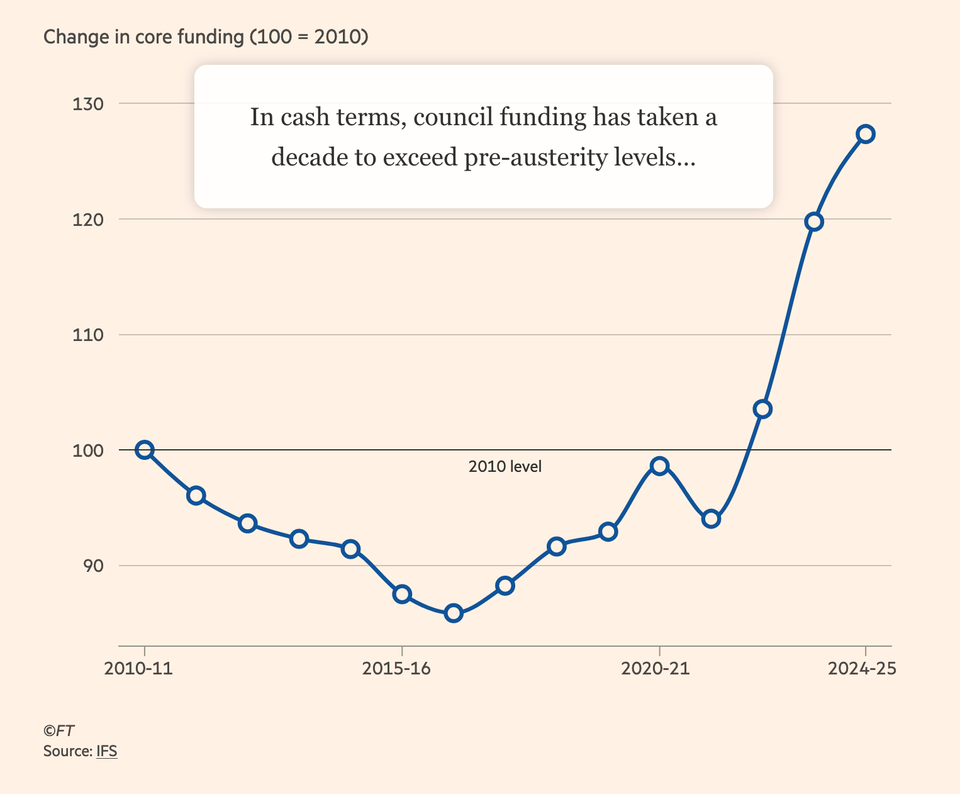
Adjust, and adjust some more
Axis

Adjust, and adjust some more

Kaiser looks at an interactive chart in the Financial Times.
Read More
← Newer Posts Page 4 of 15 Older Posts →
Junk Charts © 2026
  • BOOKS
  • COURSES
  • PRESS
  • CONSULTING
  • COACHING
  • CONTACT
Powered by Ghost