Junk Charts
  • About
  • RSS
  • Posts by Year
  • Posts by Keywords
Sign in Subscribe

Bar chart

Worst statistical graphic nominated
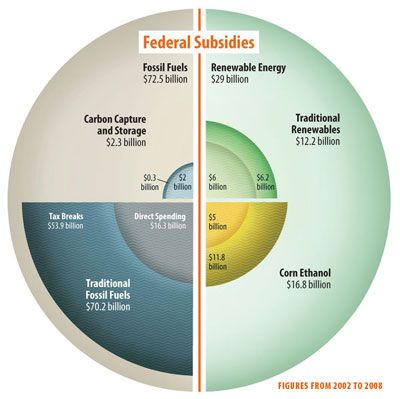
Aggregation

Worst statistical graphic nominated

Phil, over at the Gelman blog, nominates this jaw-dropping graphic as
Read More
A skewed view of ten Indian states
Axis

A skewed view of ten Indian states

The Economist published this chart to illustrate the problem of the "
Read More
An achievable target. And how?
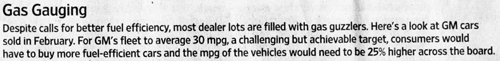
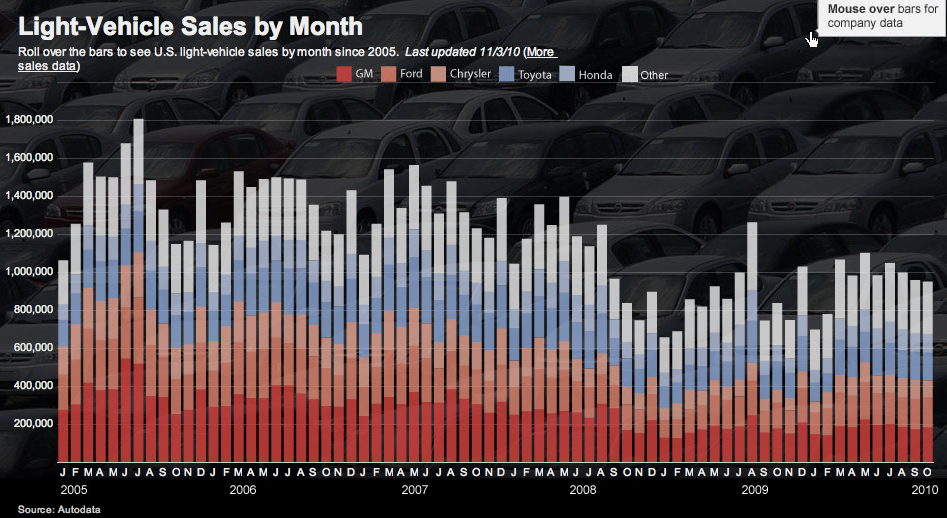
Bar chart

An achievable target. And how?

The Wall Street Journal tells us that GM car buyers may react
Read More
What is seasonal adjustment and why is it used?
Aggregation

What is seasonal adjustment and why is it used?

Quick guide to seasonal adjustments
Read More
Failed university education
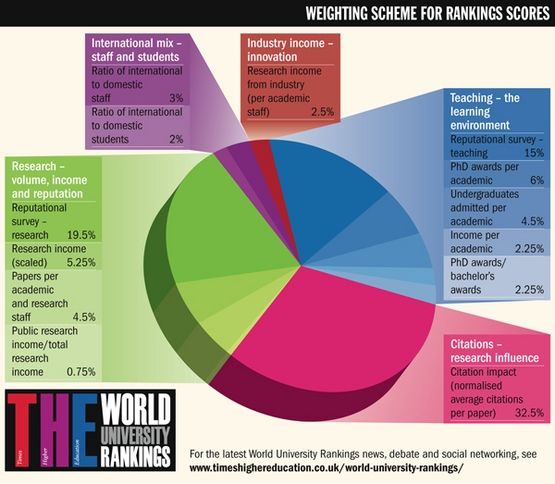
Bar chart

Failed university education

The Times Higher Education magazine fancied itself an arbiter of good universities
Read More
Stone-age graphic
Bar chart

Stone-age graphic

This Economist chart on the history of world GDP throws the art
Read More
← Newer Posts Page 15 of 21 Older Posts →
Junk Charts © 2026
  • BOOKS
  • COURSES
  • PRESS
  • CONSULTING
  • COACHING
  • CONTACT
Powered by Ghost