Junk Charts
About
RSS
Posts by Year
Posts by Keywords
Sign in
Subscribe
Bar chart
Aggregation
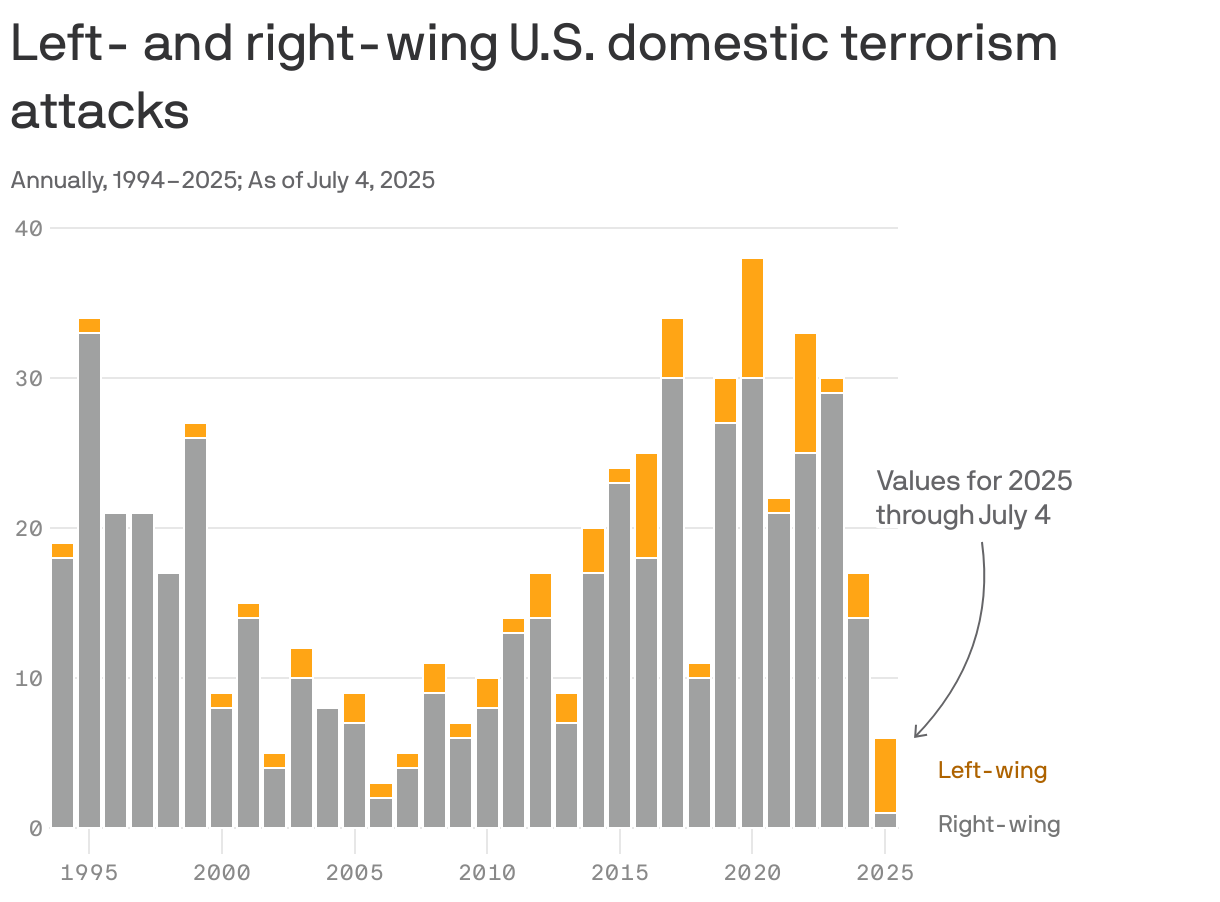
Applying the band-aid, missing the wound
Common mistakes in stacked column charts
Bar chart
Reflection on two design quirks
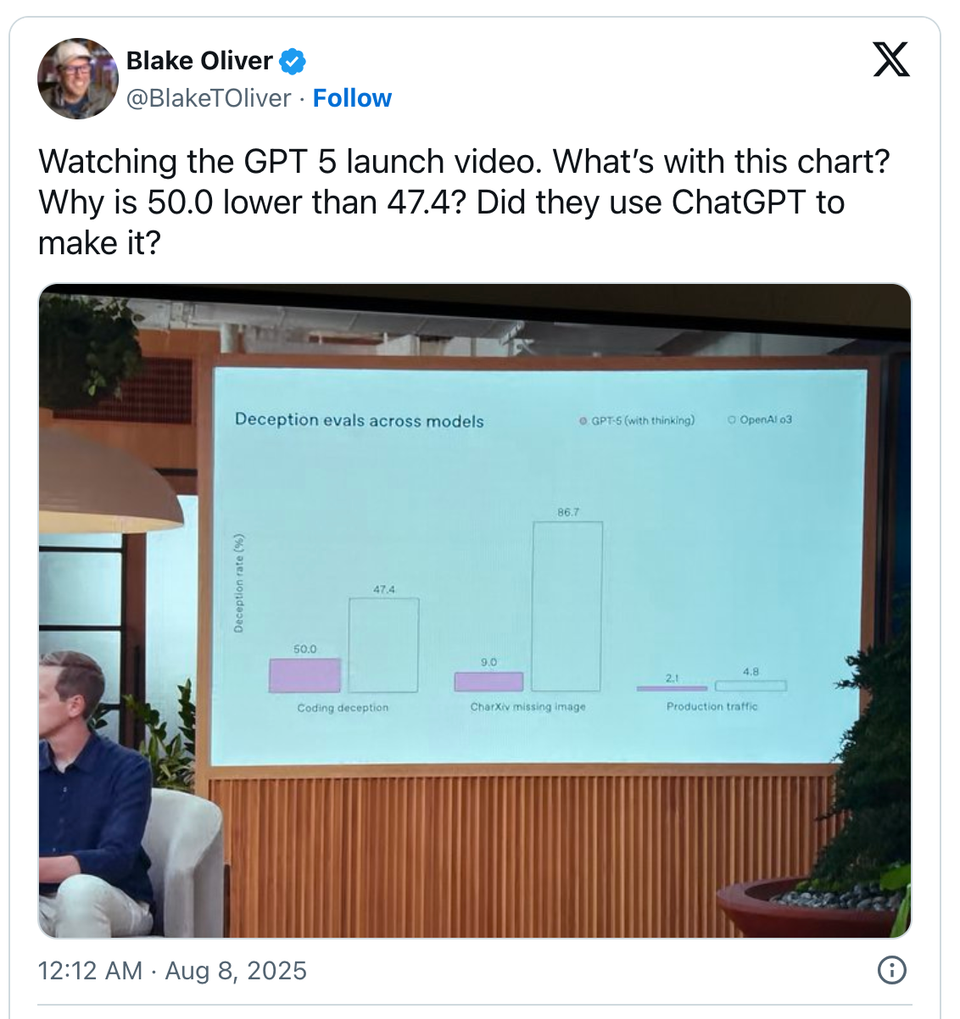
Slanting and breaking columns
openai
They won't tell you why they did it
Why do they do the crime?
Bar chart
Simple is not always easy
Simple design is not always easy
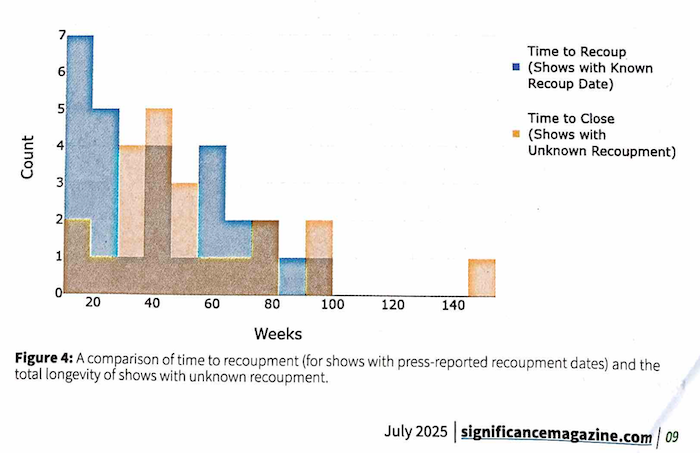
histogram
Why is this chart confusing?
A confusing chart on Broadway shows
Bar chart
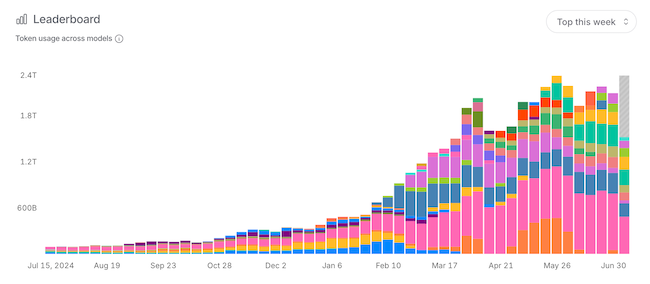
Color bomb
Color bomb in AI analytics
←
Newer Posts
Page 2 of 20
Older Posts
→