Junk Charts
  • About
  • RSS
  • Posts by Year
  • Posts by Keywords
Sign in Subscribe

Bar chart

Getting metrics right is half the battle
measurement

Getting metrics right is half the battle

Learning from some student projects
Read More
Another test of self-sufficiency
self-sufficiency test

Another test of self-sufficiency

Reading an infographic of Swiss elections
Read More
Visualizing hierarchies
sports analytics

Visualizing hierarchies

Bonus: setting gridlines on a circular chart
Read More
Forced roommates, favoritism, and more in data visualization
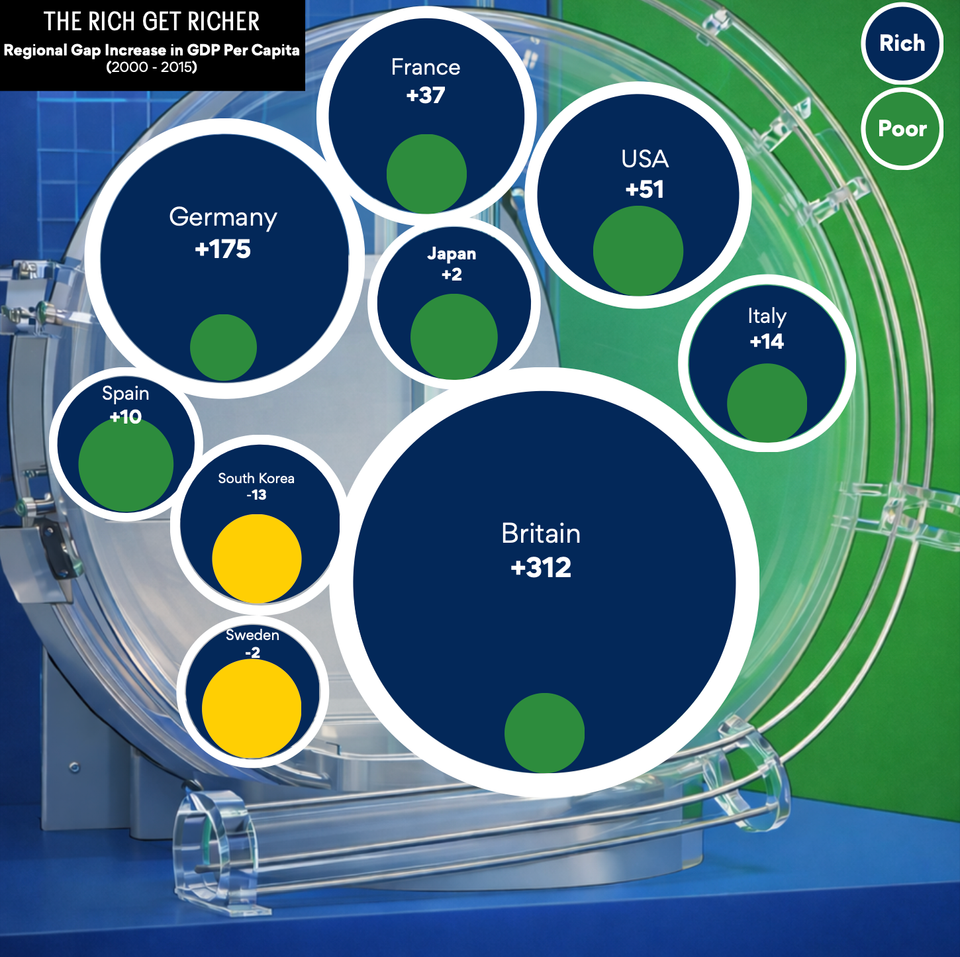
dual axes

Forced roommates, favoritism, and more in data visualization

Why is this dual-axes chart so taxing to read?
Read More
Ten pie charts. Are you worried yet?
Pie chart

Ten pie charts. Are you worried yet?

Ten pie charts about American worries
Read More
Applying the band-aid, missing the wound
Aggregation

Applying the band-aid, missing the wound

Common mistakes in stacked column charts
Read More
← Newer Posts Page 2 of 21 Older Posts →
Junk Charts © 2026
  • BOOKS
  • COURSES
  • PRESS
  • CONSULTING
  • COACHING
  • CONTACT
Powered by Ghost