Junk Charts
About
RSS
Posts by Year
Posts by Keywords
Sign in
Subscribe
Bar chart
Bar chart
Making colors and groups come alive
How to use color effectively in a dataviz
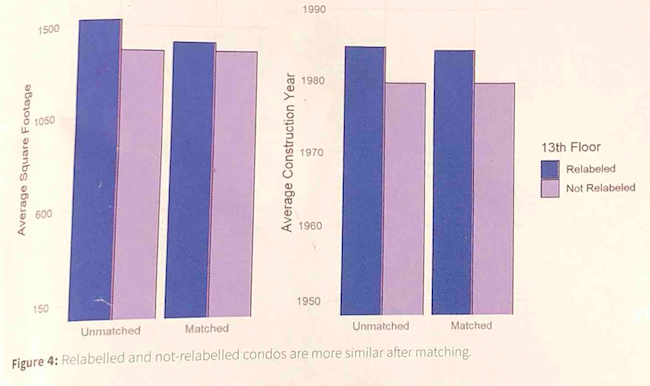
Bar chart
When should we use bar charts?
Kaiser looks at two column charts.
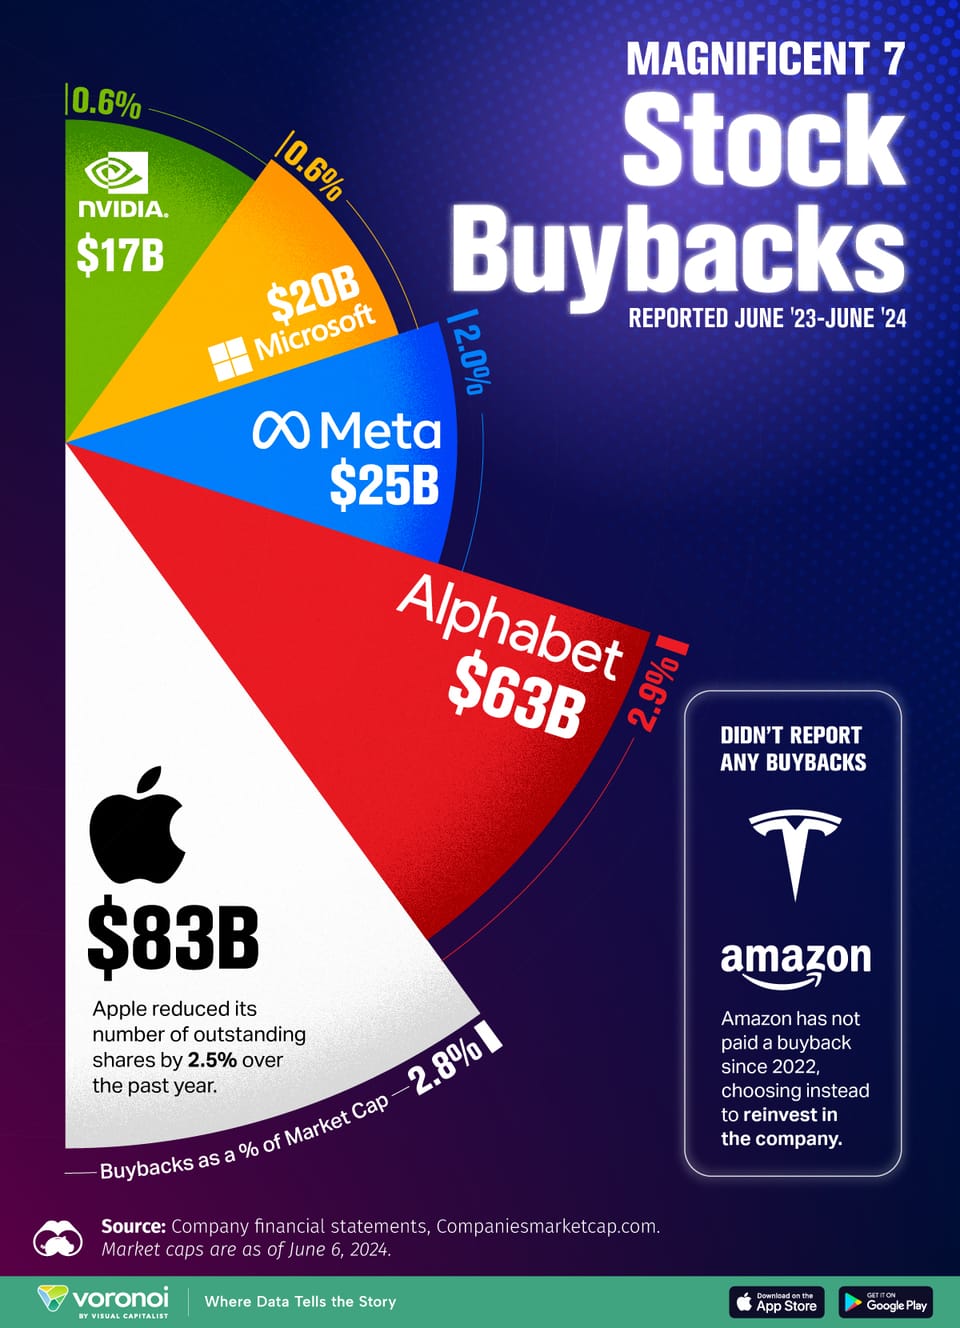
Bar chart
Is this dataviz?
Kaiser looks for the data behind this pie chart.
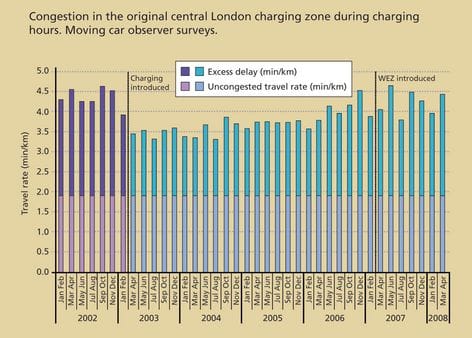
Bar chart
Excess delay
Kaiser finds a chart that analyzes London's congestion charging programme.
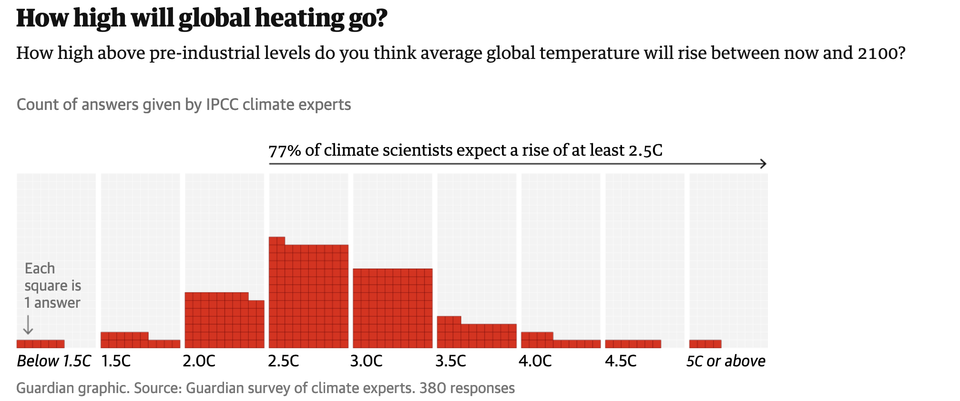
Axis
Chart without an axis
Kaiser looks at a variant of a standard chart form.
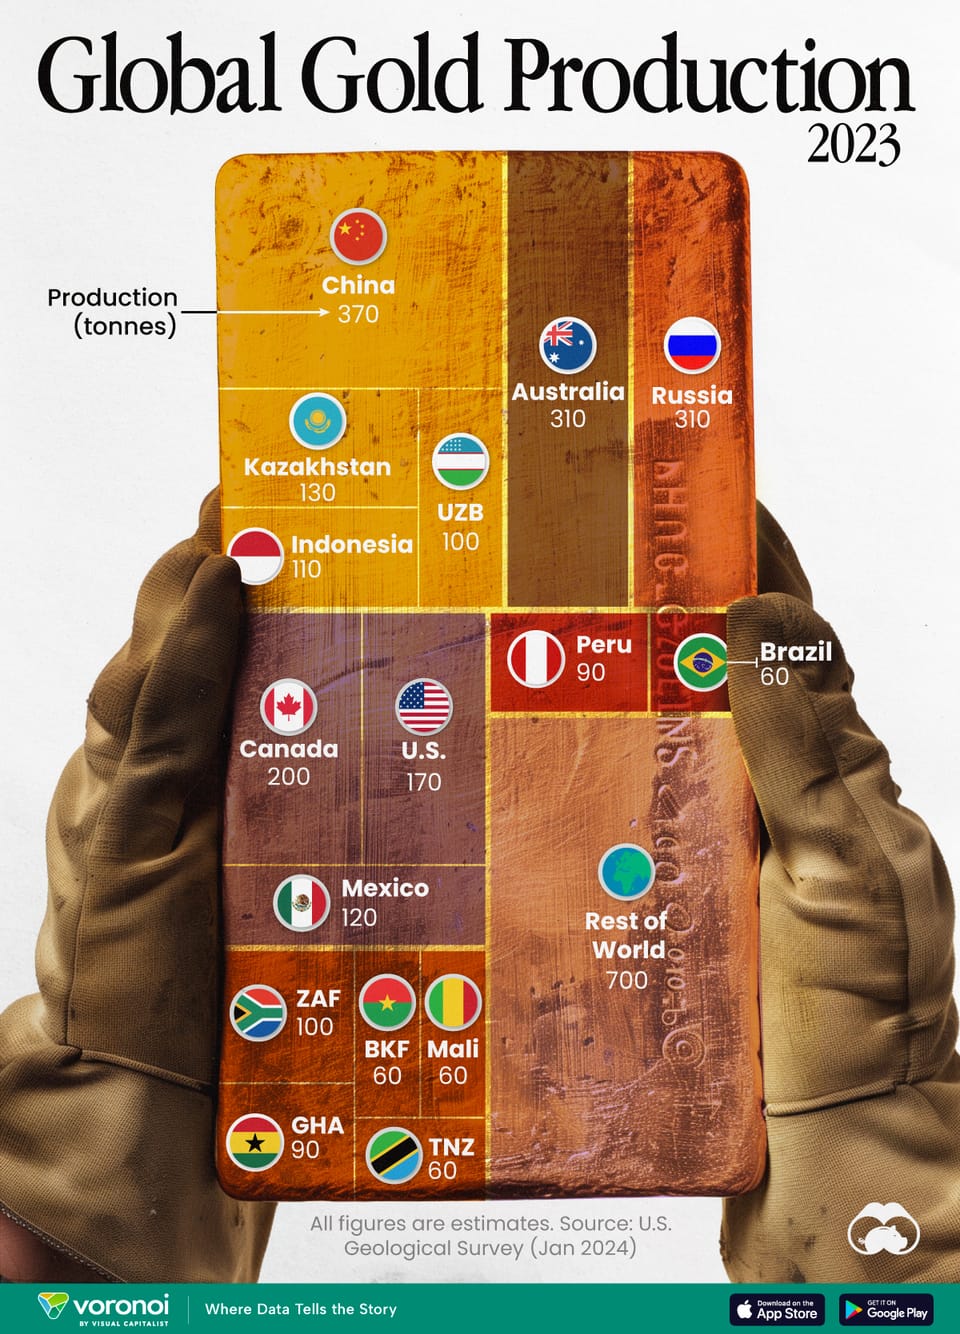
Aggregation
One doesn't have to plot raw data
Kaiser looks at gold production worldwide.
←
Newer Posts
Page 6 of 20
Older Posts
→