Junk Charts
  • About
  • RSS
  • Posts by Year
  • Posts by Keywords
Sign in Subscribe

Boxplot

Five-value summaries of distributions
Boxplot

Five-value summaries of distributions

Using five numbers ot summarize data distributions
Read More
What is this "stacked range chart"?
Aggregation

What is this "stacked range chart"?

Do we need this "stacked range chart"?
Read More
An overused chart, why it fails, and how to fix it
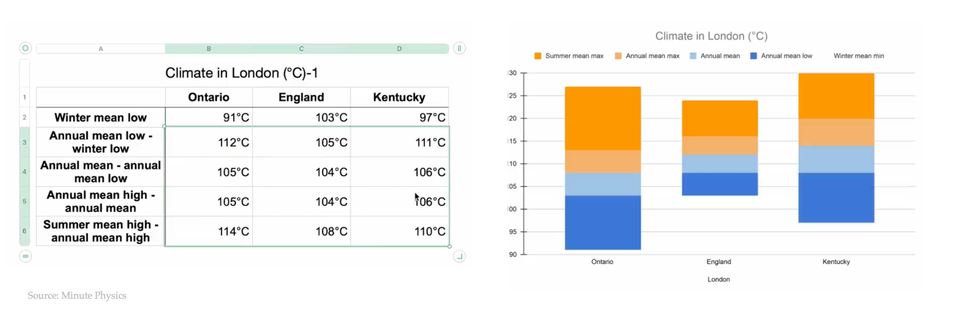
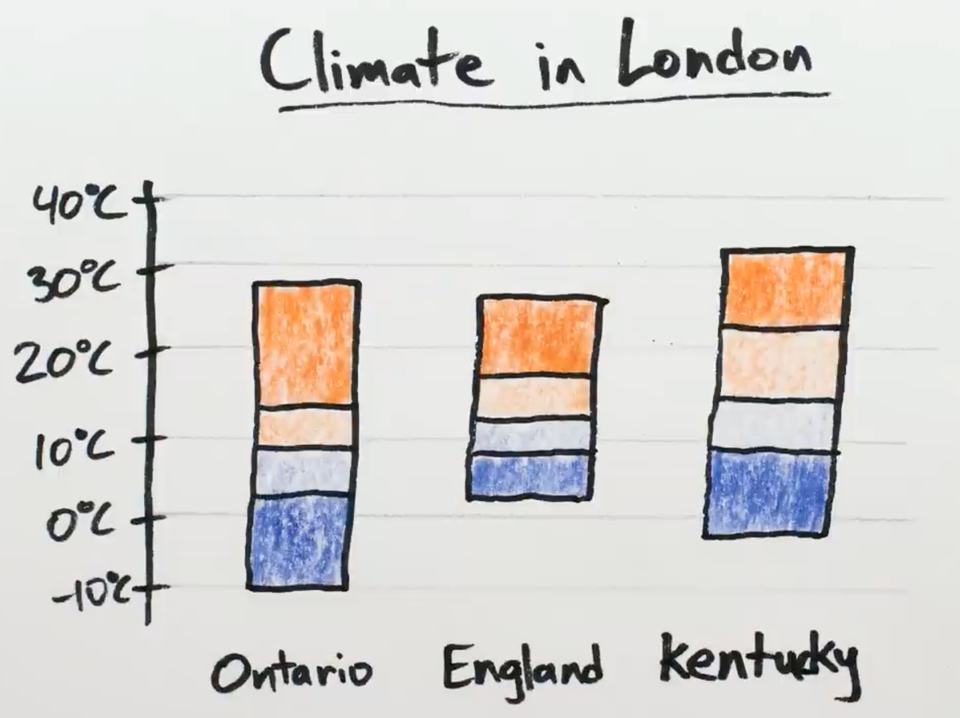
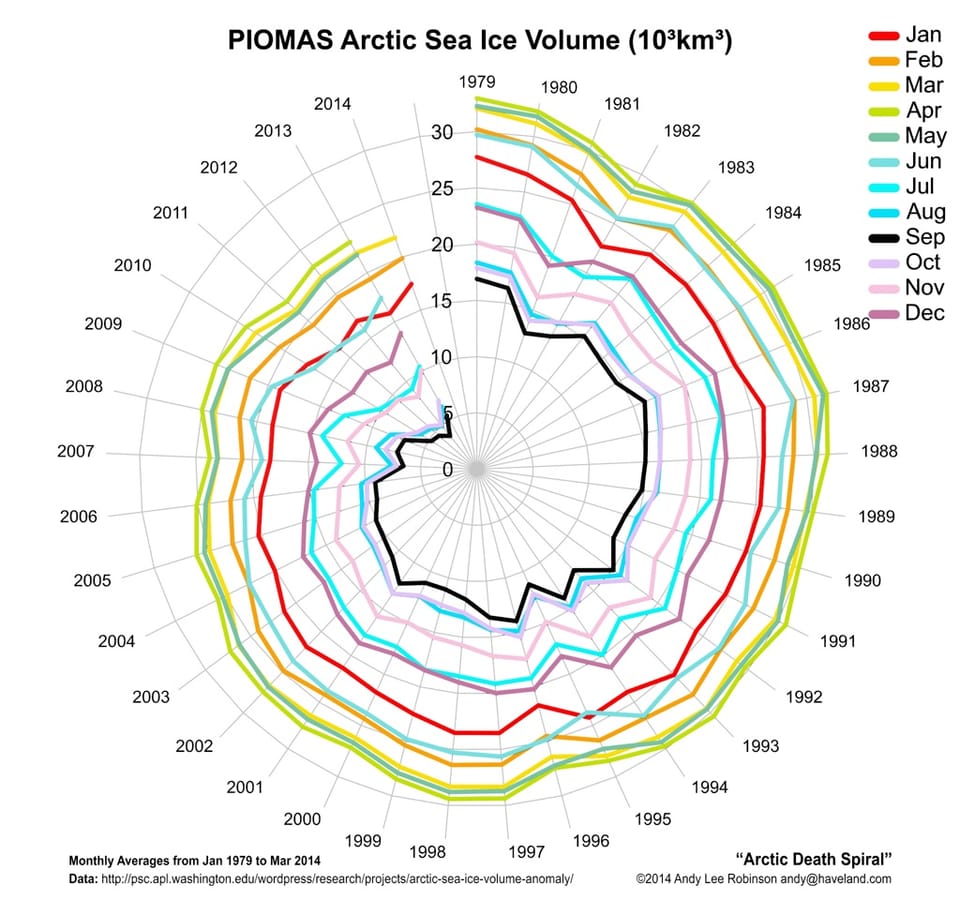
Spider chart

An overused chart, why it fails, and how to fix it

A chart with conceptual appeal but fails the data
Read More
Different pictures of unemployment
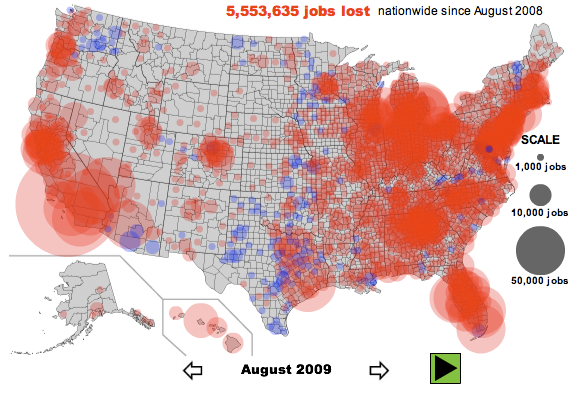
Aggregation

Different pictures of unemployment

Unemployment and job losses being such a worrying social problem in the
Read More
Self-sufficient charts
Boxplot

Self-sufficient charts

A good example showed up in the New York Times recently of
Read More
Calming the rip tide
Blogs

Calming the rip tide

Xan Gregg at Forth Go helpfully scraped the auto market share data
Read More
Page 1 of 1
Junk Charts © 2025
  • BOOKS
  • COURSES
  • PRESS
  • CONSULTING
  • COACHING
  • CONTACT
Powered by Ghost