Analytics-business interaction An example of terrible analytics report design In the business analytics universe, the discipline of "business intelligence"
Aggregation How to get fired, the data scientist edition Investors of Herbalife (HLF) are owed a full explanation of the metrics
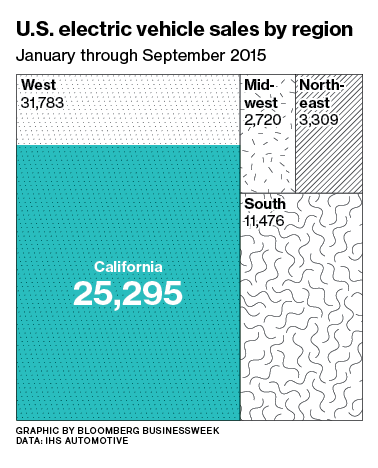
Area chart Finding meaning in Big Blue California Via Twitter, Pat complained that this Bloomberg graphic is confusing: The accompanying
Analytics-business interaction Theranos and ethics I have to admit I missed the hype about Elizabeth Holmes, and
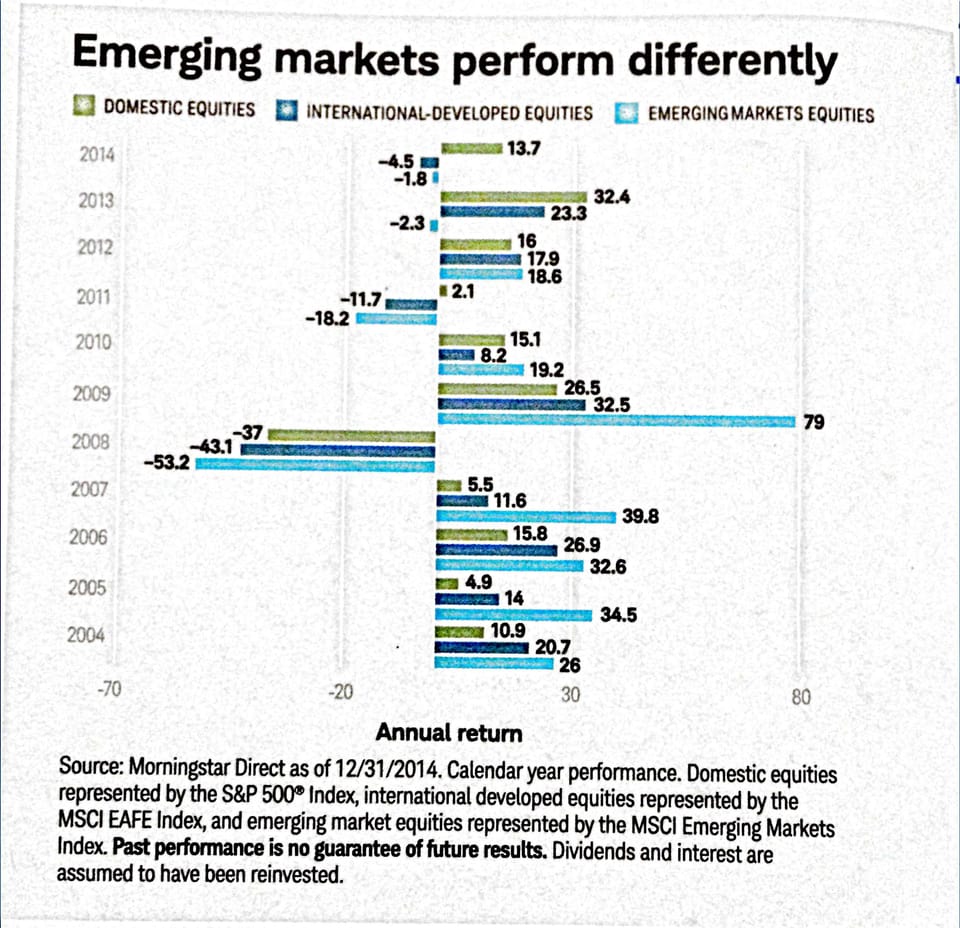
Axis Nice title but dubious message I like to uaeuse declarative titles for charts. This chart below, found