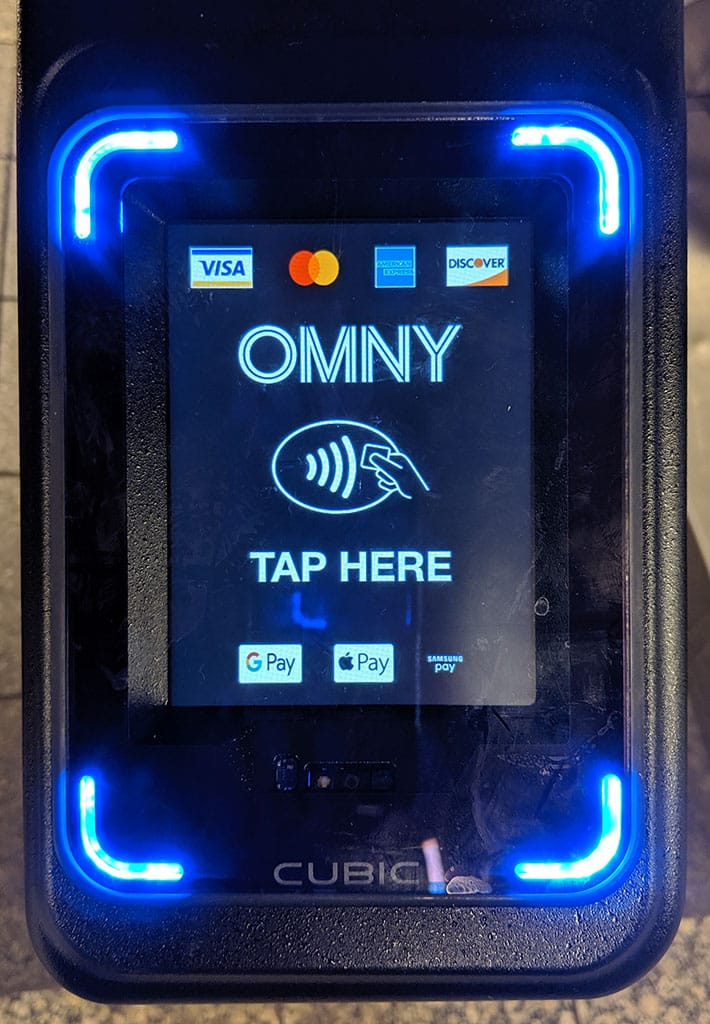
Junk Charts
  • About
  • RSS
  • Posts by Year
  • Posts by Keywords
Sign in Subscribe

Business

OMNY needs a facelift
Behavior

OMNY needs a facelift

OMNY has a bigger screen but displays less information
Read More
Why is this chart confusing?
histogram

Why is this chart confusing?

A confusing chart on Broadway shows
Read More
Color bomb
Bar chart

Color bomb

Color bomb in AI analytics
Read More
Know your data 46: using our data to set pricing
Algorithms

Know your data 46: using our data to set pricing

Know your data 46: how they manipulate prices based on analyzing your surveillance data
Read More
Students demonstrate how analytics underlie strong dataviz
ray vella

Students demonstrate how analytics underlie strong dataviz

Students demonstrate the value of analytics to data visualization
Read More
Nonlinear thinking in marketing
marketing analytics

Nonlinear thinking in marketing

Reporting from Avinash's talk on see think do care
Read More
← Newer Posts Page 2 of 30 Older Posts →
Junk Charts © 2025
  • BOOKS
  • COURSES
  • PRESS
  • CONSULTING
  • COACHING
  • CONTACT
Powered by Ghost