Junk Charts
About
RSS
Posts by Year
Posts by Keywords
Sign in
Subscribe
climate
Boxplot
Five-value summaries of distributions
Using five numbers ot summarize data distributions
Aggregation
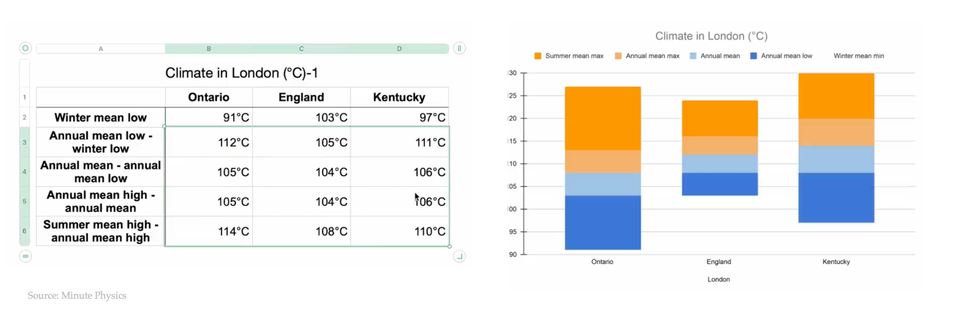
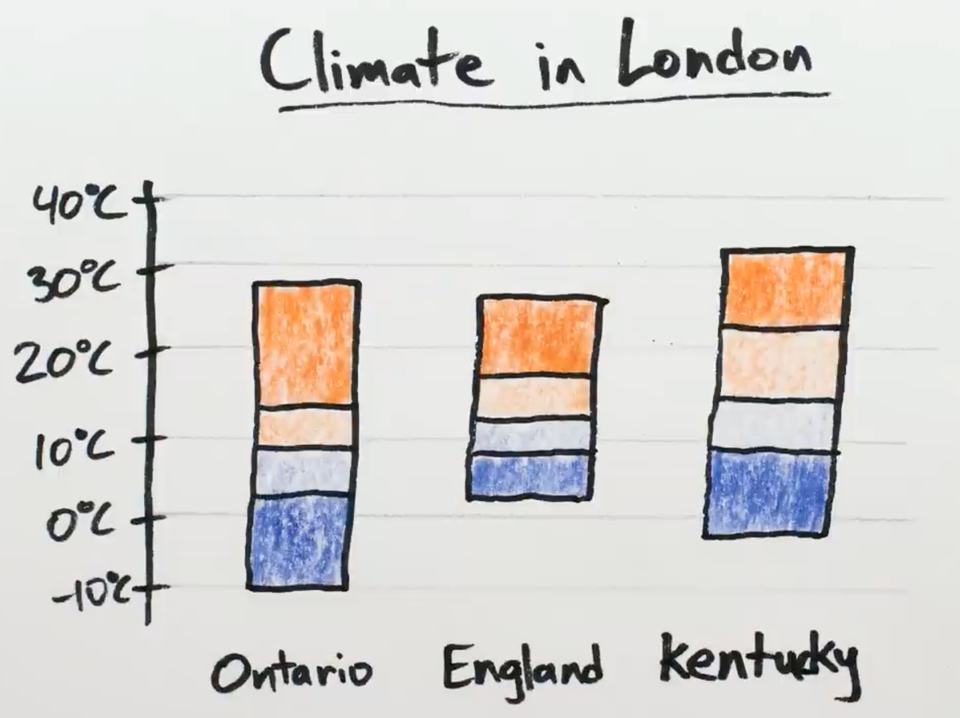
What is this "stacked range chart"?
Do we need this "stacked range chart"?
Aggregation
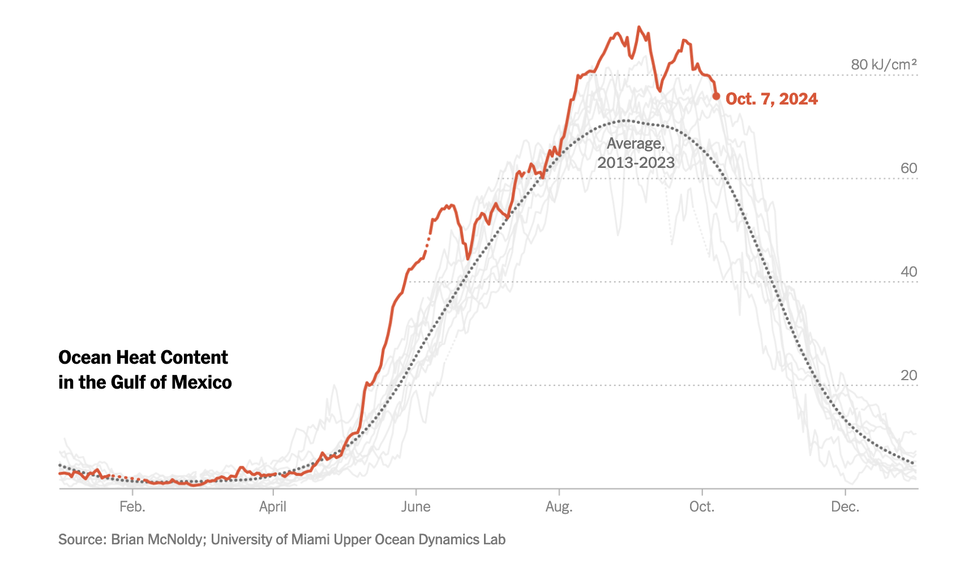
Visualizing extremes
Nice NYT chart showing weather extremes
Page 1 of 1