Junk Charts
About
RSS
Posts by Year
Posts by Keywords
Sign in
Subscribe
comparison
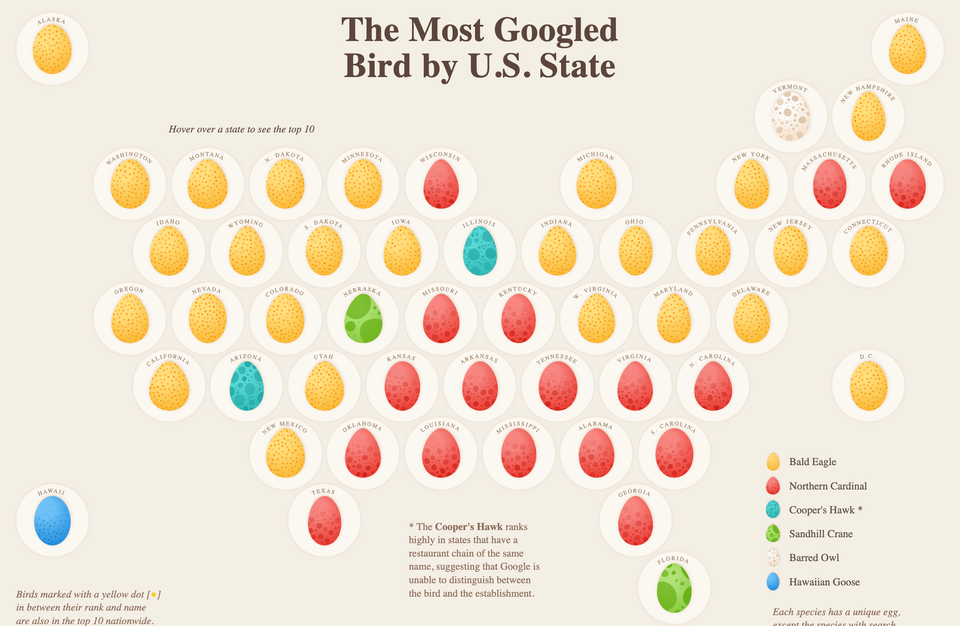
Map
Maps of Top X
Exploring a popular way of making maps
measurement
Getting metrics right is half the battle
Learning from some student projects
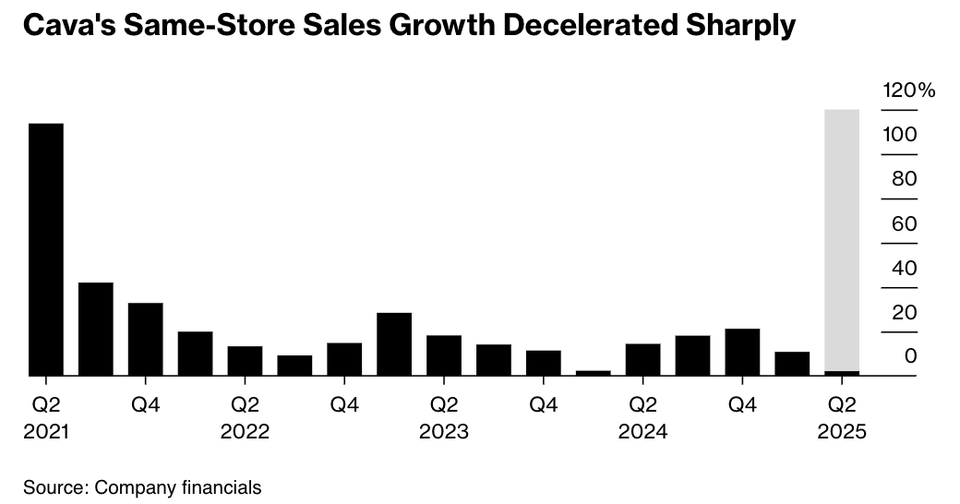
Bar chart
Simple is not always easy
Simple design is not always easy
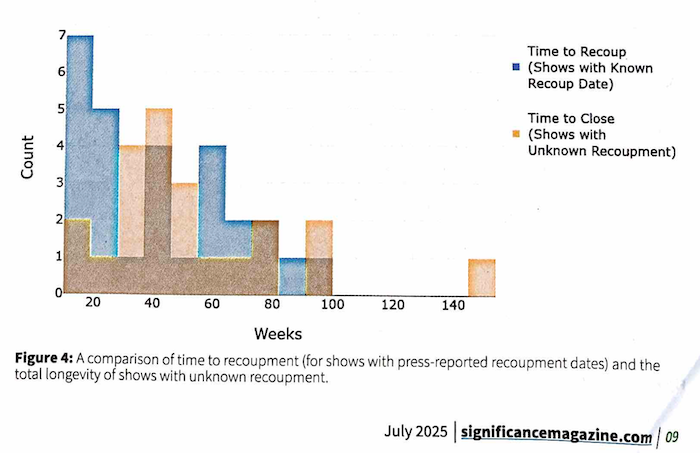
histogram
Why is this chart confusing?
A confusing chart on Broadway shows
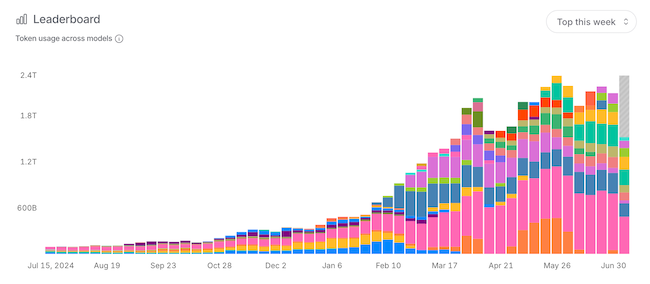
Bar chart
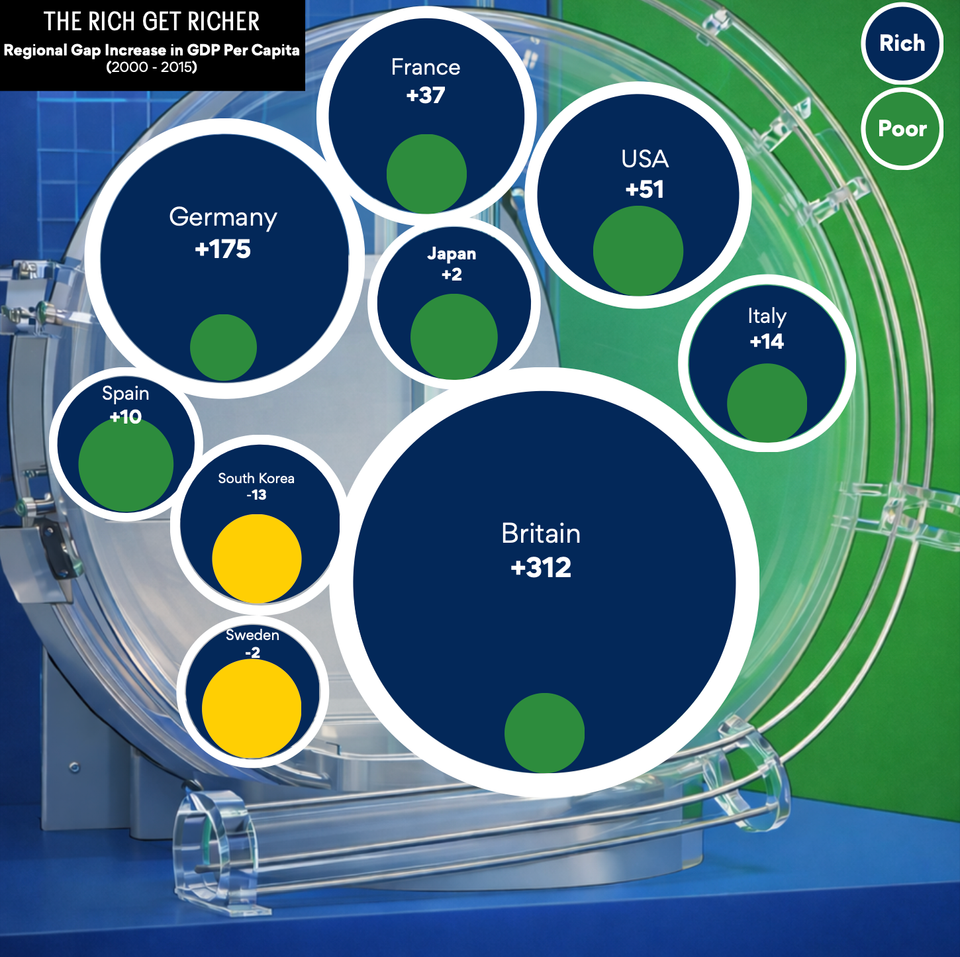
Color bomb
Color bomb in AI analytics
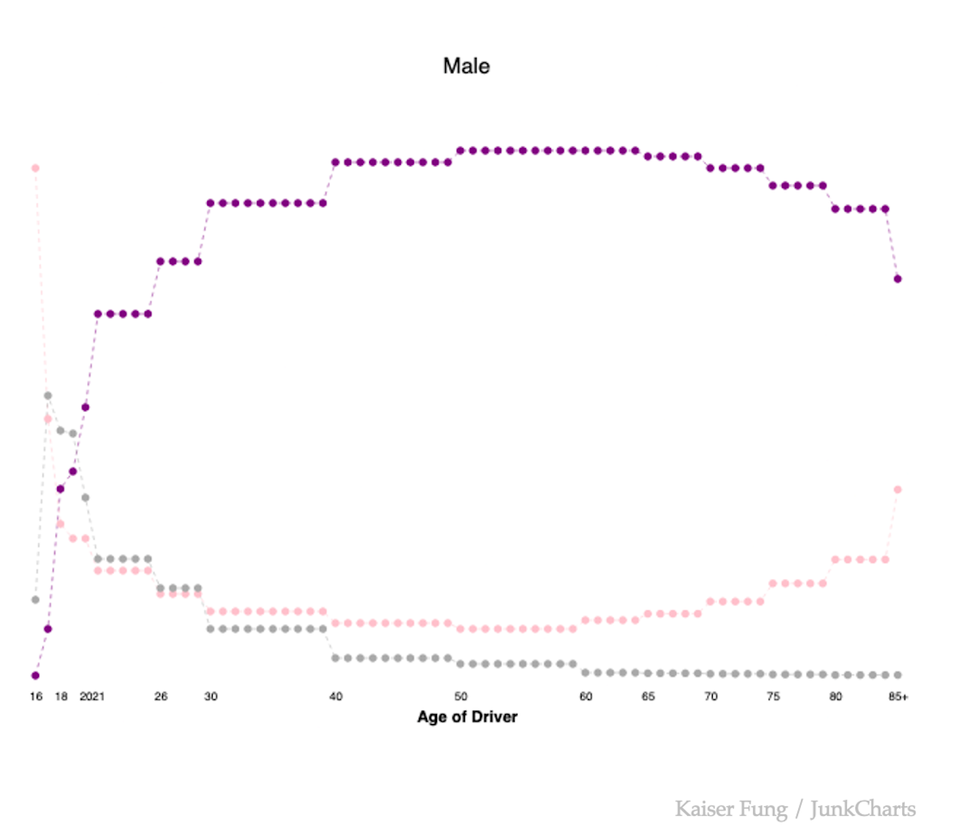
Dot plot
Making major things easy, revisited
Making important things easier, part 2
Page 1 of 2
Older Posts
→