Junk Charts
  • About
  • RSS
  • Posts by Year
  • Posts by Keywords
Sign in Subscribe

Composition

Students demonstrate how analytics underlie strong dataviz
ray vella

Students demonstrate how analytics underlie strong dataviz

Students demonstrate the value of analytics to data visualization
Read More
Combining probabilities
Aggregation

Combining probabilities

Kaiser explains how probabilities are aggregated.
Read More
Neither the forest nor the trees
Business

Neither the forest nor the trees

Kaiser attempts to read a treemap of stock market values.
Read More
To a new year of pleasant surprises
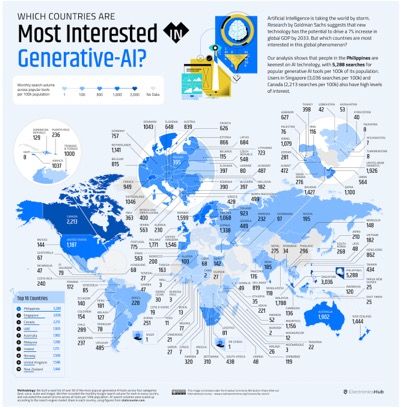
Business

To a new year of pleasant surprises

Kaiser finds a noisy map of the AI space. Happy new year!
Read More
Displaying convoluted indices
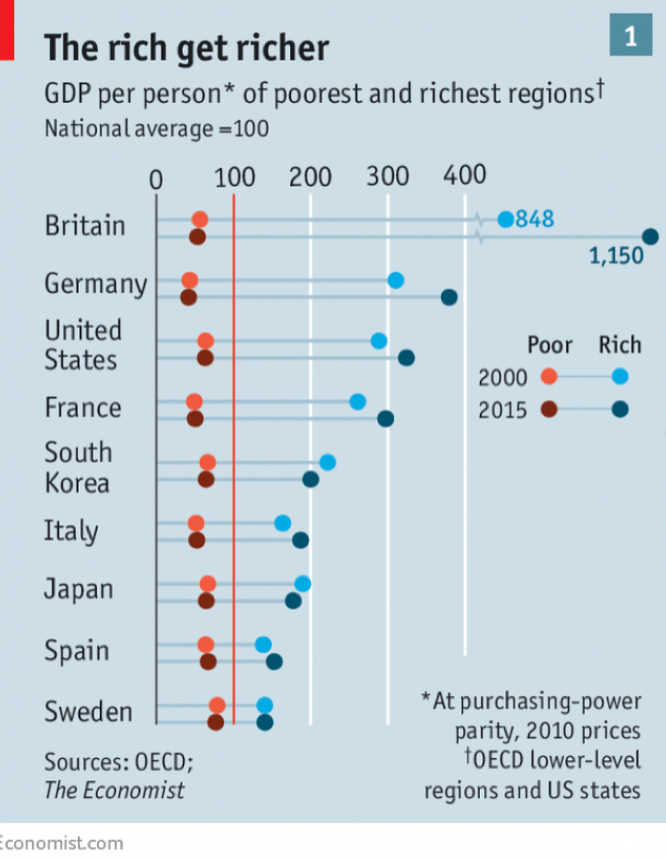
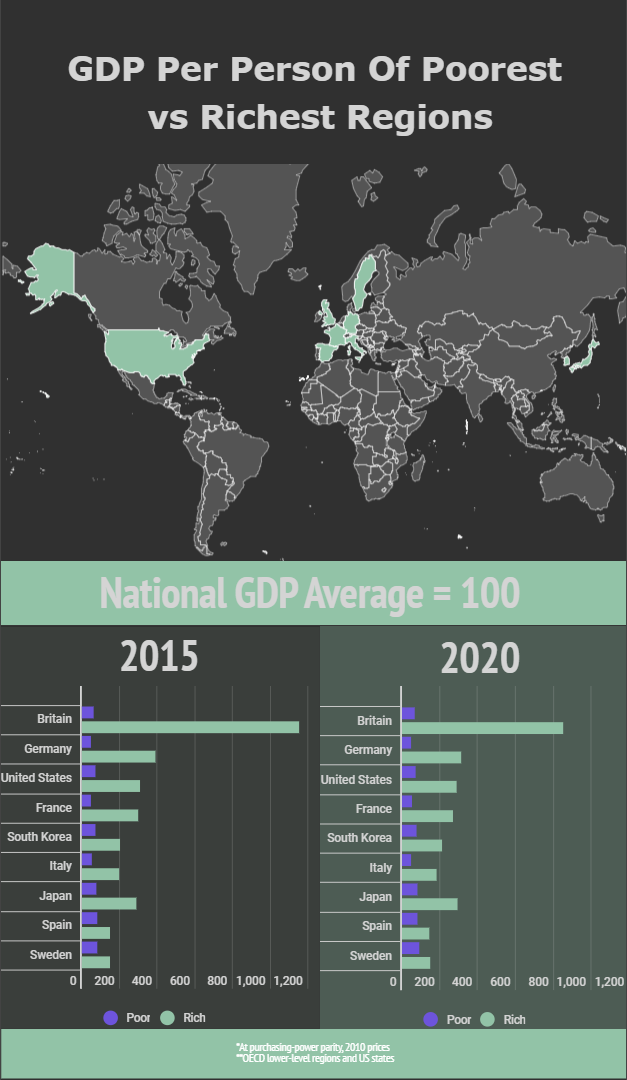
ray vella

Displaying convoluted indices

Kaiser shows how a small change in structure clarifies comparisons on a data visualization project.
Read More
Let's not mix these polarized voters as the medians run away from one another
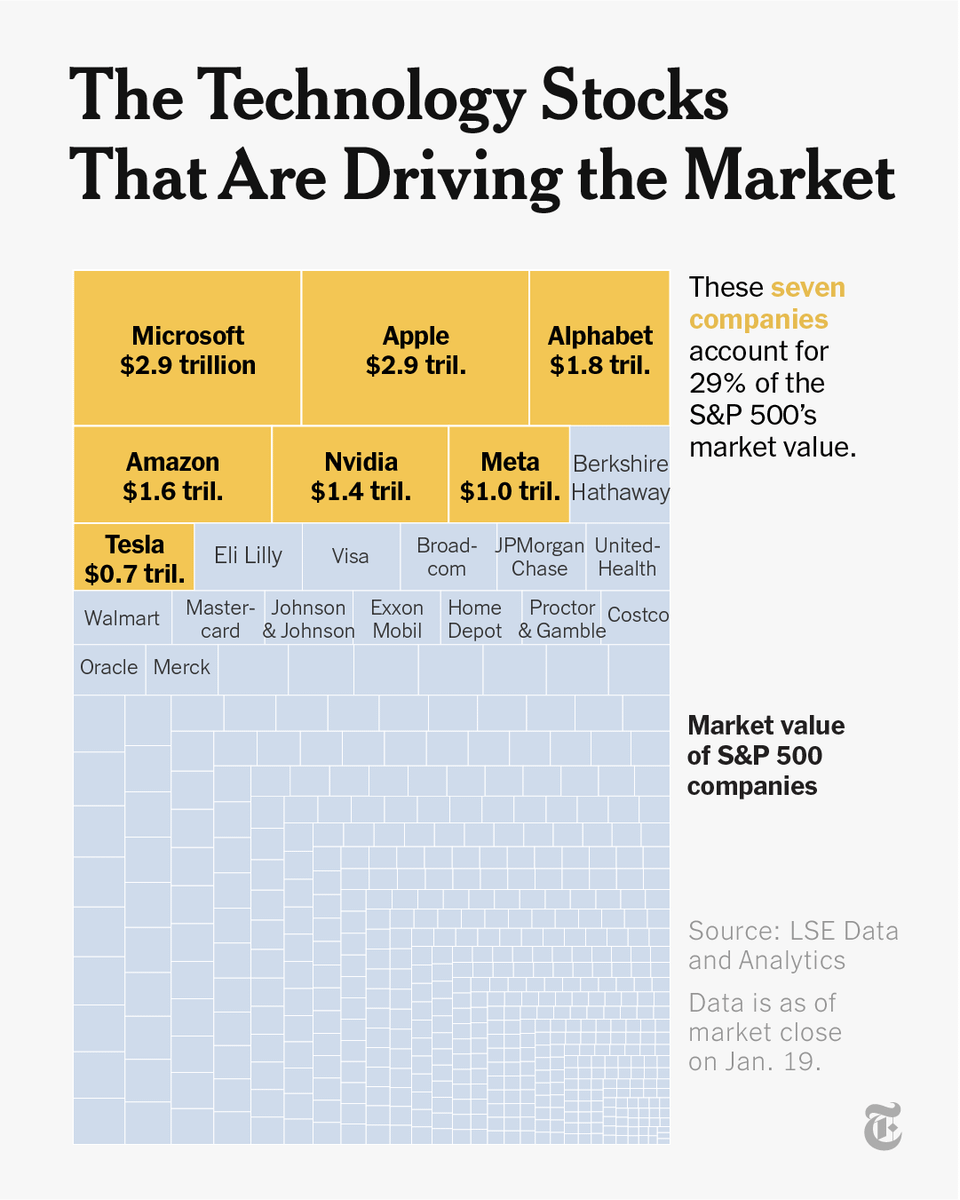
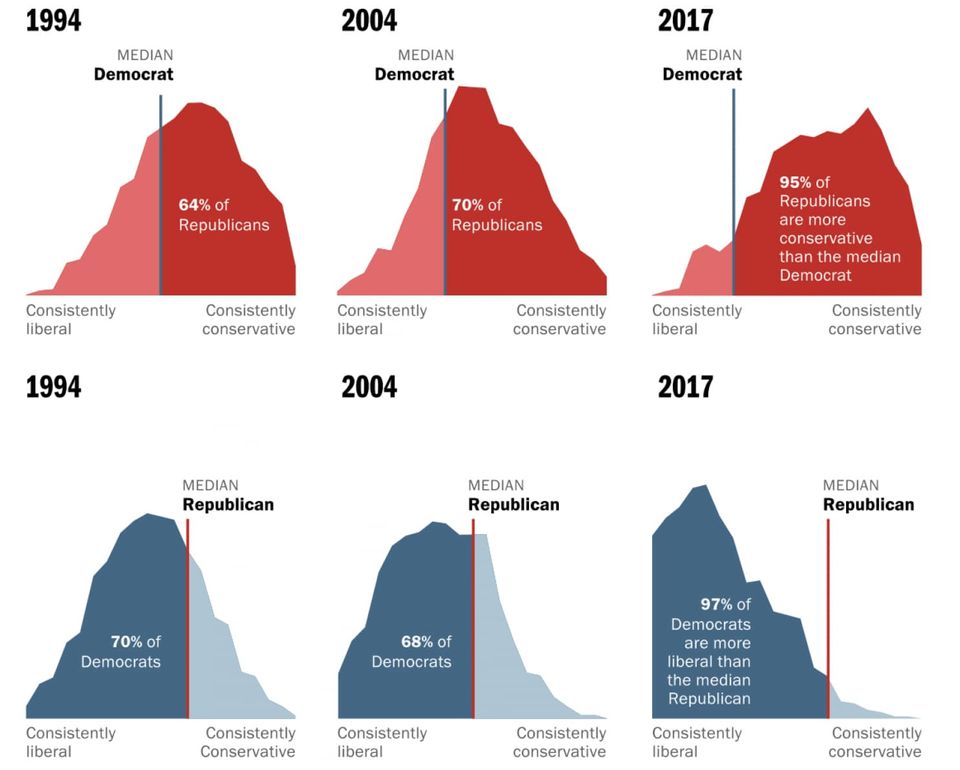
Area chart

Let's not mix these polarized voters as the medians run away from one another

In-depth look at Washington Post's fantastic feature on median U.S. voters
Read More
Page 1 of 2 Older Posts →
Junk Charts © 2026
  • BOOKS
  • COURSES
  • PRESS
  • CONSULTING
  • COACHING
  • CONTACT
Powered by Ghost