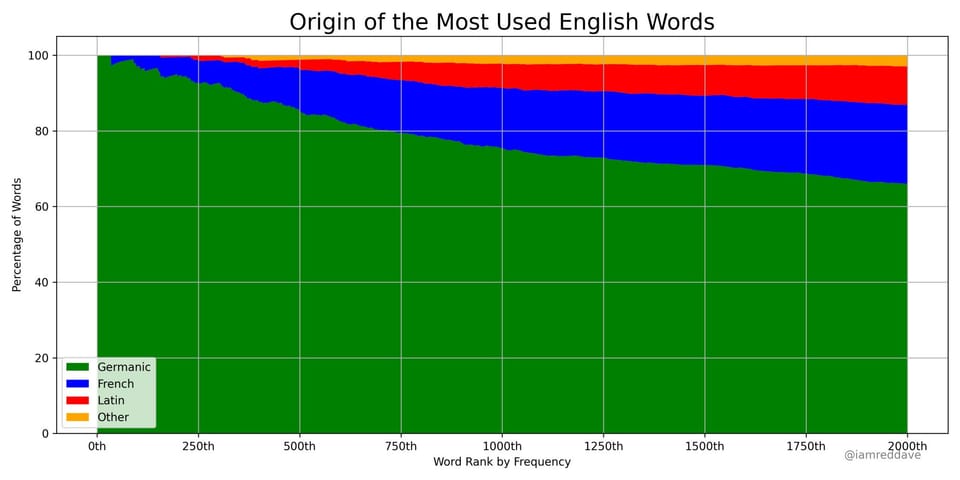
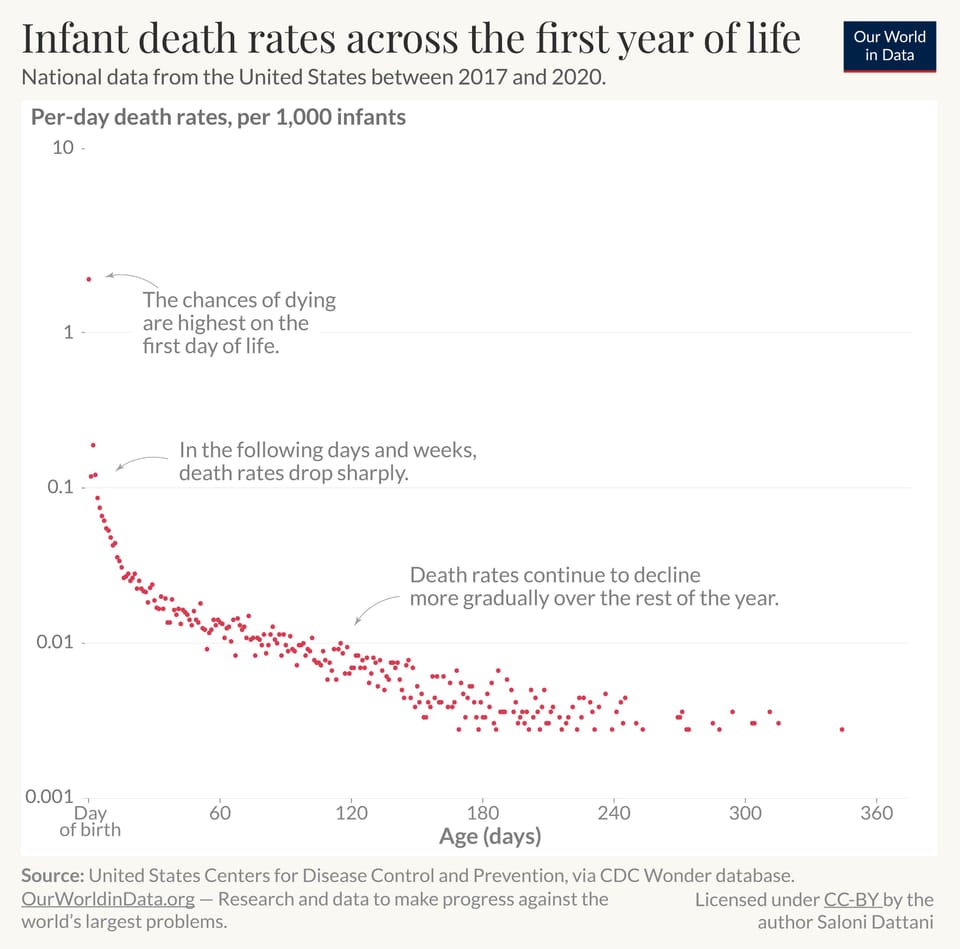
Area chart Two challenging charts showing group distributions Two complex charts that show subgroup distributions of data
Cause-effect Other numbers from the colonoscopy trial Kaiser highlights some other metrics from the colonoscopy study