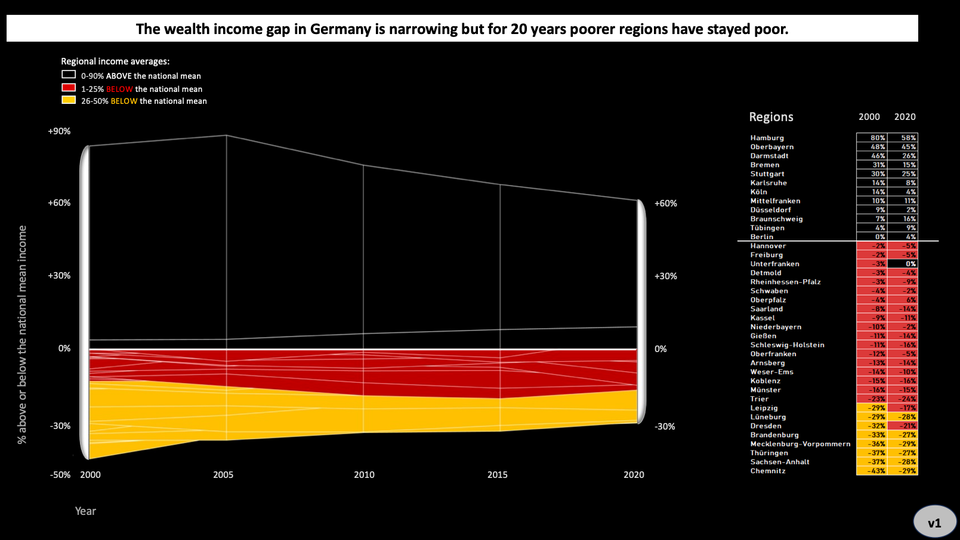
Junk Charts
  • About
  • RSS
  • Posts by Year
  • Posts by Keywords
Sign in Subscribe

data visualization

Coffee in different shapes and sizes: a test of self-sufficiency
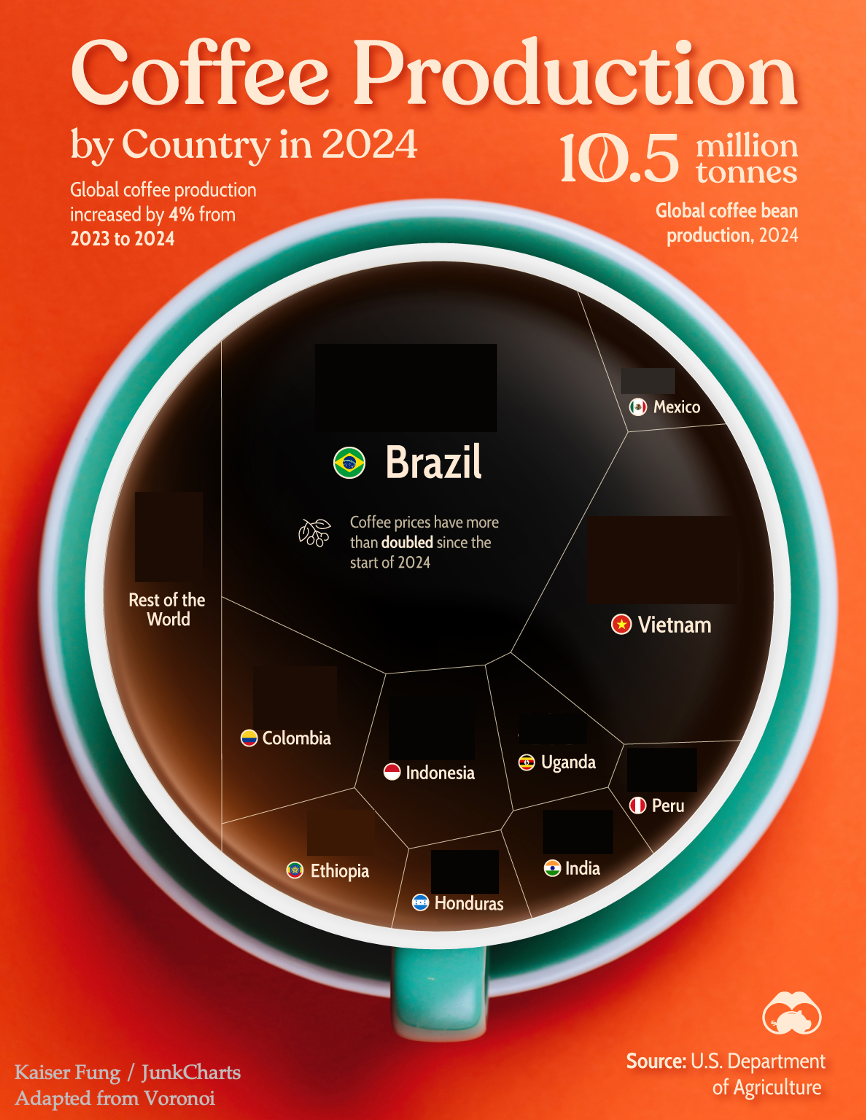
treemap

Coffee in different shapes and sizes: a test of self-sufficiency

You'd need more coffee to read this chart
Read More
The reckless practice of eyeballing trend lines
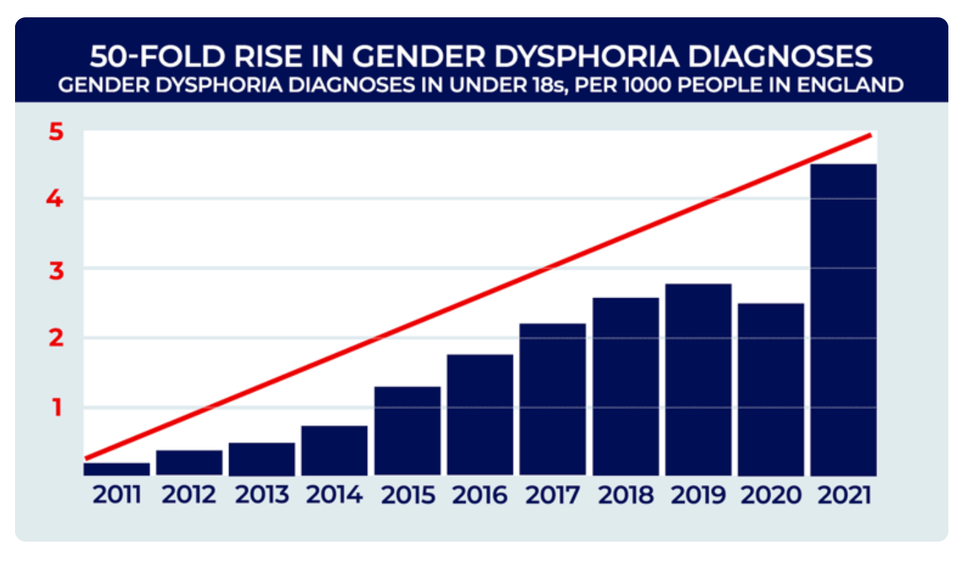
Bar chart

The reckless practice of eyeballing trend lines

The reckless practice of eyeballing trend lines
Read More
Making major things easy, revisited
Dot plot

Making major things easy, revisited

Making important things easier, part 2
Read More
Organizing time-stamped data
Aggregation

Organizing time-stamped data

Re-organizing the time stamps of Elon Musk tweets
Read More
Equal-area histograms
histogram

Equal-area histograms

Kaiser explores a variant of the histogram for plotting data distributions.
Read More
Vaccine researchers discard the start-at-zero rule
Axis

Vaccine researchers discard the start-at-zero rule

Kaiser revisits the practice of manipulating the vertical axis of a column chart.
Read More
← Newer Posts Page 3 of 5 Older Posts →
Junk Charts © 2025
  • BOOKS
  • COURSES
  • PRESS
  • CONSULTING
  • COACHING
  • CONTACT
Powered by Ghost