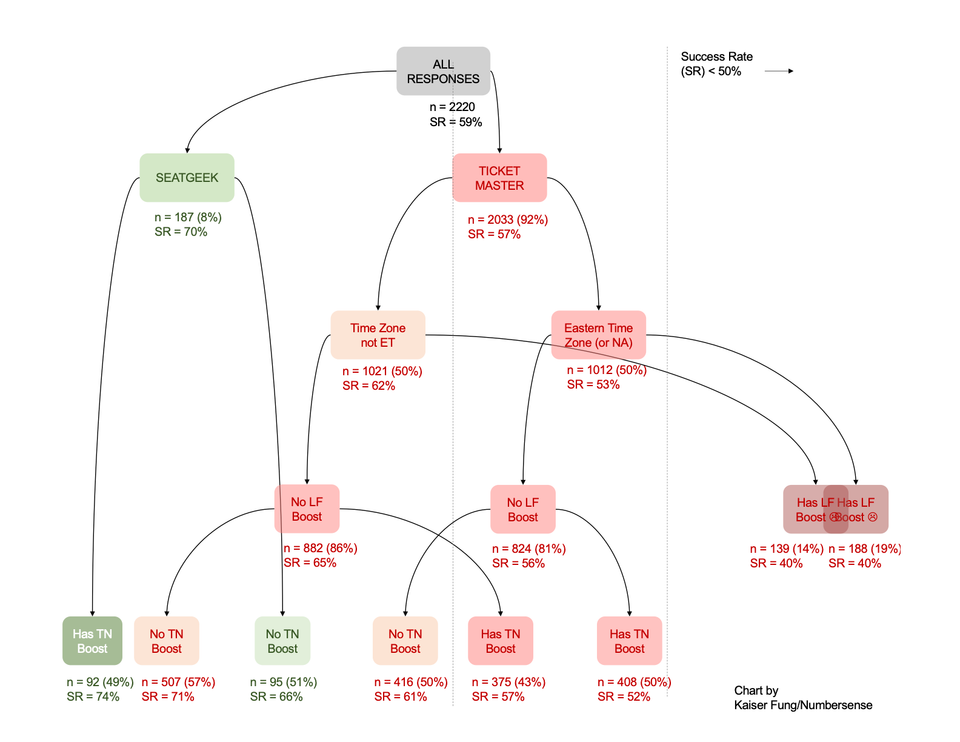
Algorithms The Taylor Swift ticketing fiasco Kaiser analyzes some survey data on Taylor Swift pre-sales for Slate
Analytics-business interaction Beneath the surface of recent Google, Elon, FCC news Kaiser looks at several recent news stories related to people' s data
Analytics-business interaction Self-checkout takes another hit Kaiser notes that some retailers are finally admitting the true cost of self-checkout technology.
observational studies All evidence are not created equal and some evidence are more equal than others Kaiser considers the controversy over the recent colonoscopy trial results.
Statisticians Critics, stories, and ethics Kaiser reads an interview with the Chief Demographer of the U.S.