Junk Charts
  • About
  • RSS
  • Posts by Year
  • Posts by Keywords
Sign in Subscribe

density

Avinash's scoring rubric for data visualization
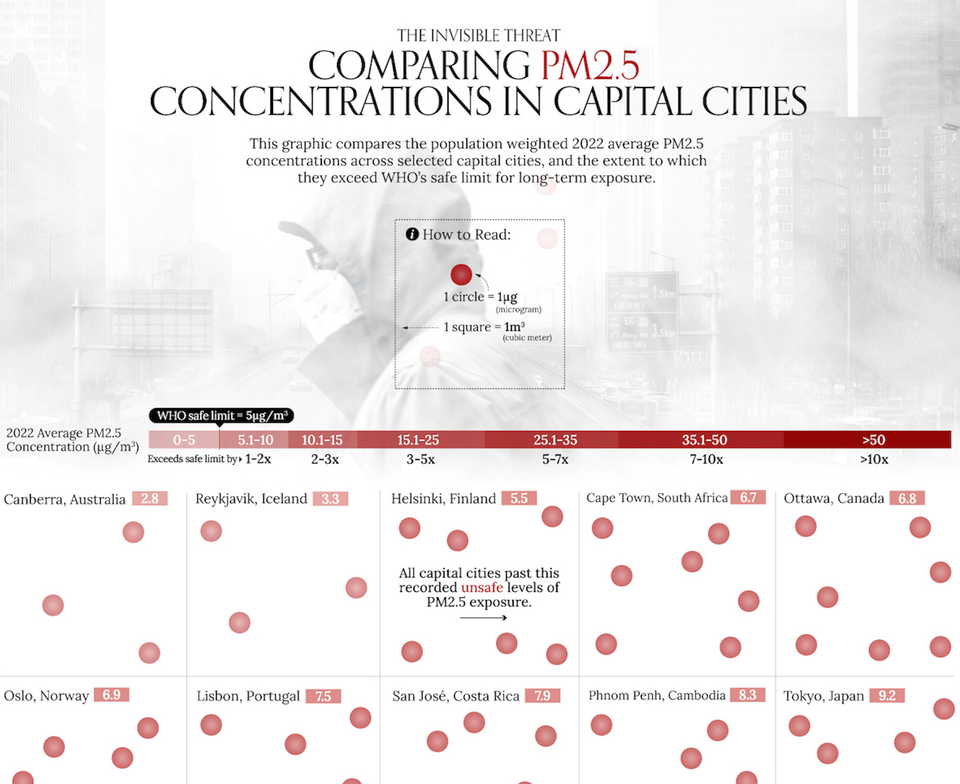
data visualization

Avinash's scoring rubric for data visualization

Eight ingredients of great graphics
Read More
Don't show everything
Aggregation

Don't show everything

Plotting lots of data but conveying not much information
Read More
A nice plot of densities, but what's behind the colors?
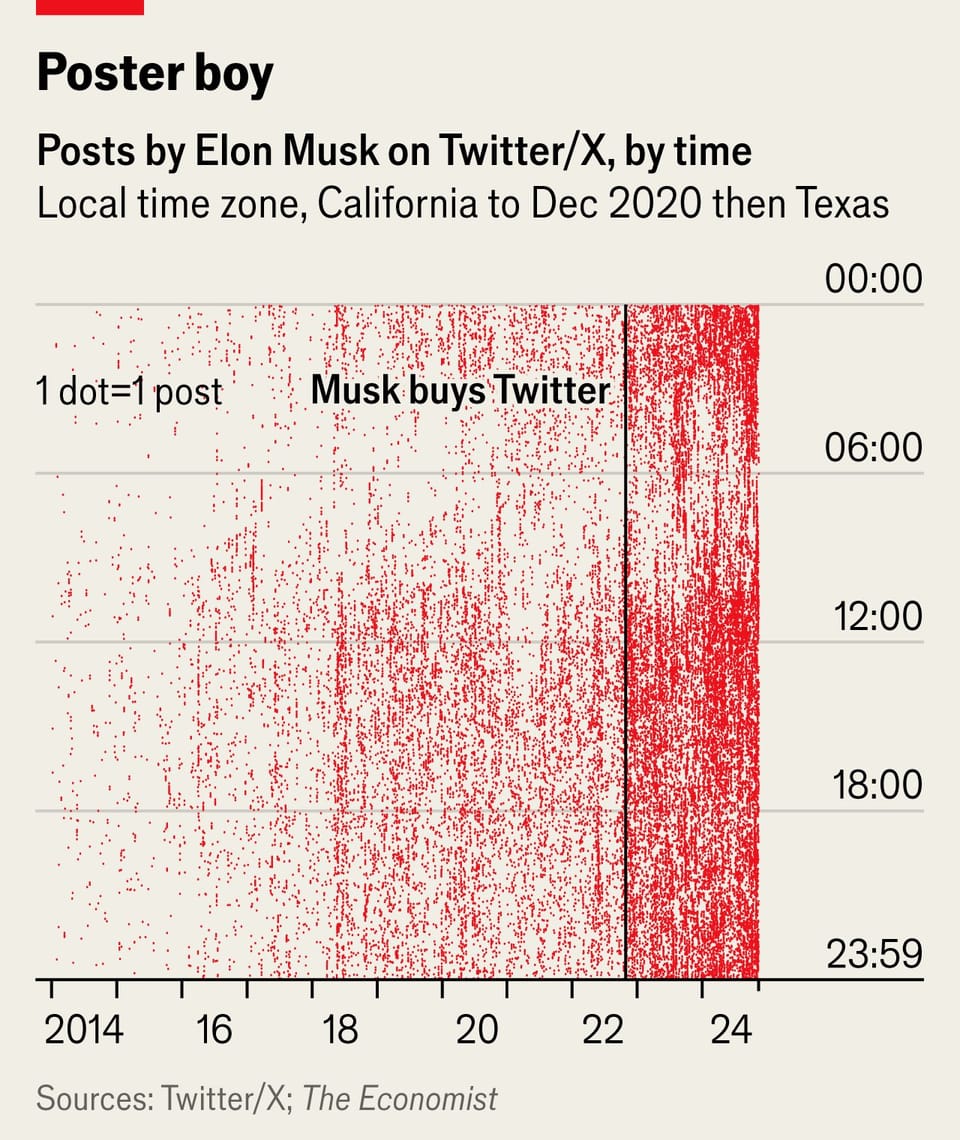
density

A nice plot of densities, but what's behind the colors?

Kaiser is intrigued by a plot of densities.
Read More
Page 1 of 1
Junk Charts © 2025
  • BOOKS
  • COURSES
  • PRESS
  • CONSULTING
  • COACHING
  • CONTACT
Powered by Ghost