Junk Charts
About
RSS
Posts by Year
Posts by Keywords
Sign in
Subscribe
distribution
Aggregation
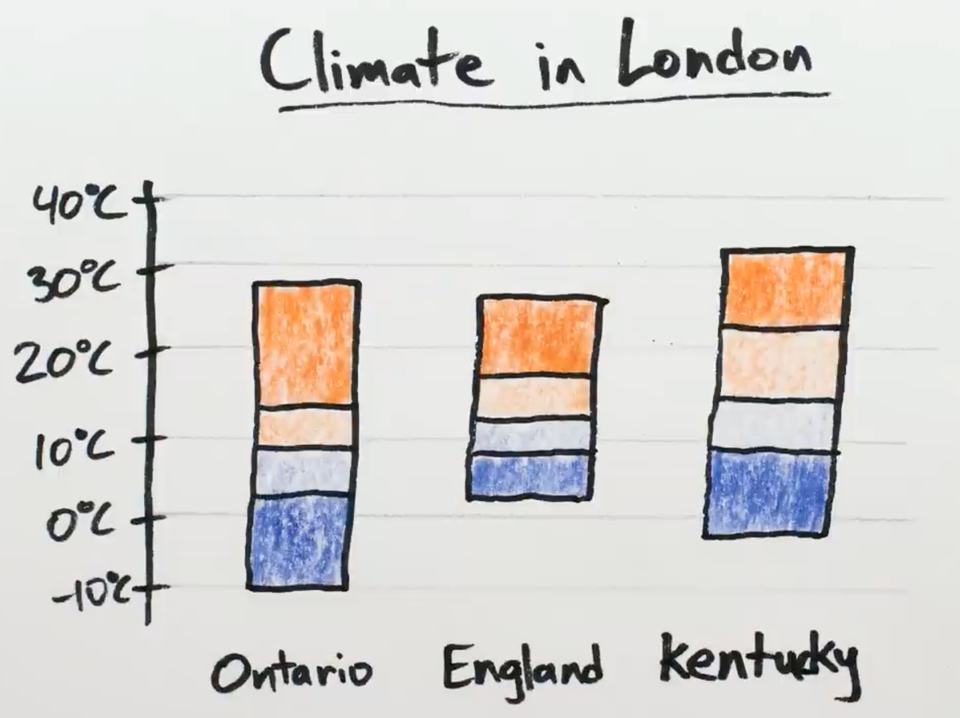
What is this "stacked range chart"?
Do we need this "stacked range chart"?
missing data
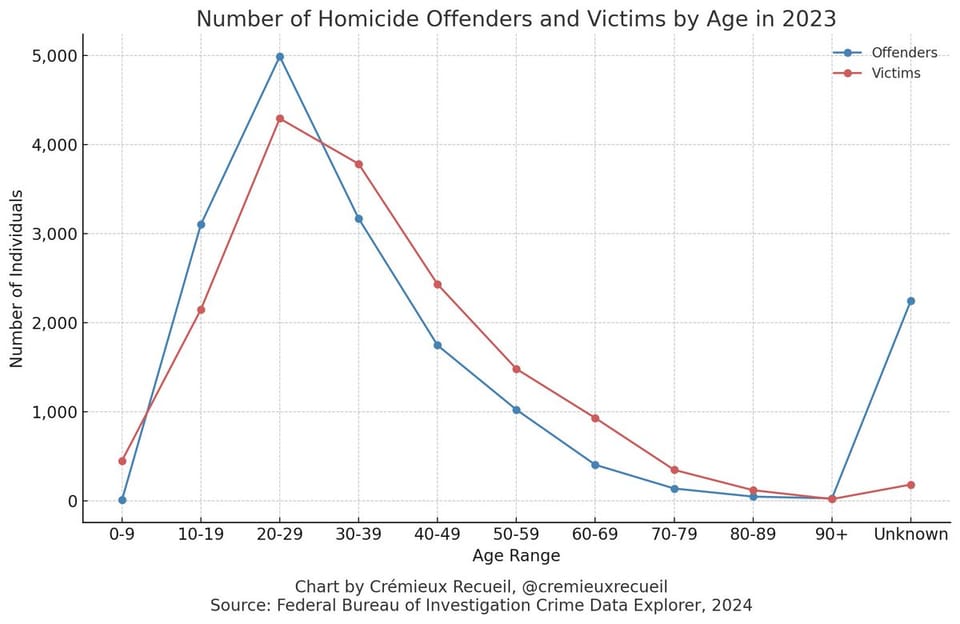
Criminal graphics graphical crime
Comparing the difference between two lines
Bar chart
My talk next week on histograms
Kaiser will be giving a talk next week.
←
Newer Posts
Page 2 of 2