Junk Charts
About
RSS
Posts by Year
Posts by Keywords
Sign in
Subscribe
Dot plot
Bar chart
Chart cleanup
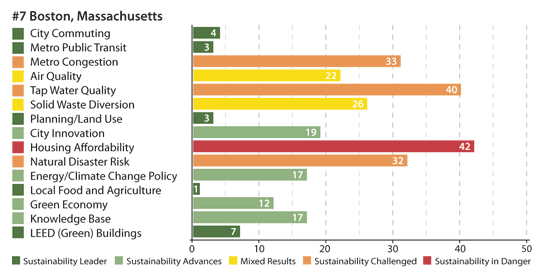
Anna E. submitted this great example from Yahoo! Green. A well-meaning
Dot plot
March mildness
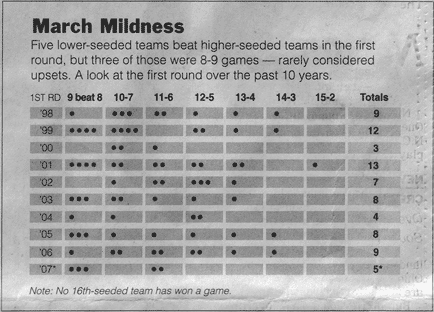
The Times published this great graphic to show 2007 was an upset-
Axis
Convenience charting
Statisticians have long riled against "convenience sampling", that is, the
←
Newer Posts
Page 7 of 7