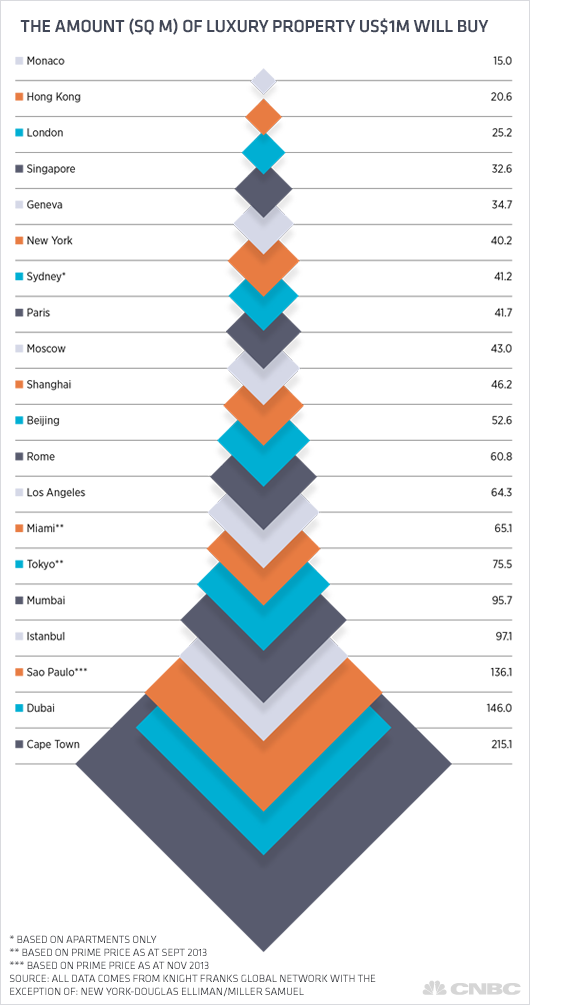
Junk Charts
  • About
  • RSS
  • Posts by Year
  • Posts by Keywords
Sign in Subscribe

Economics

Nothing to see here
Blogs

Nothing to see here

Some graphics are made to inform, some to amuse, some to delight.
Read More
Applying numbersense to a Bloomberg report
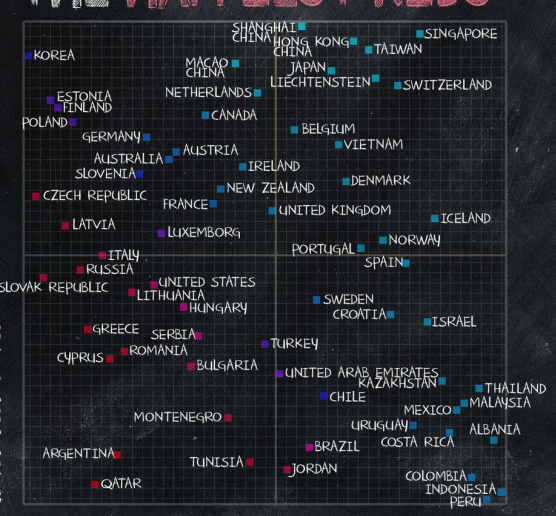
Blogs

Applying numbersense to a Bloomberg report

Eric P. asked me to comment on his recent post via twitter.
Read More
The importance of a proper scale
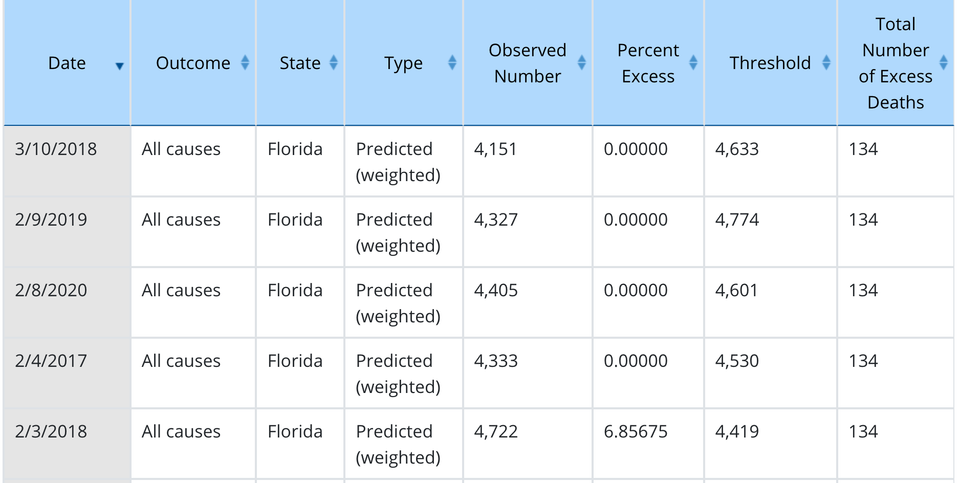
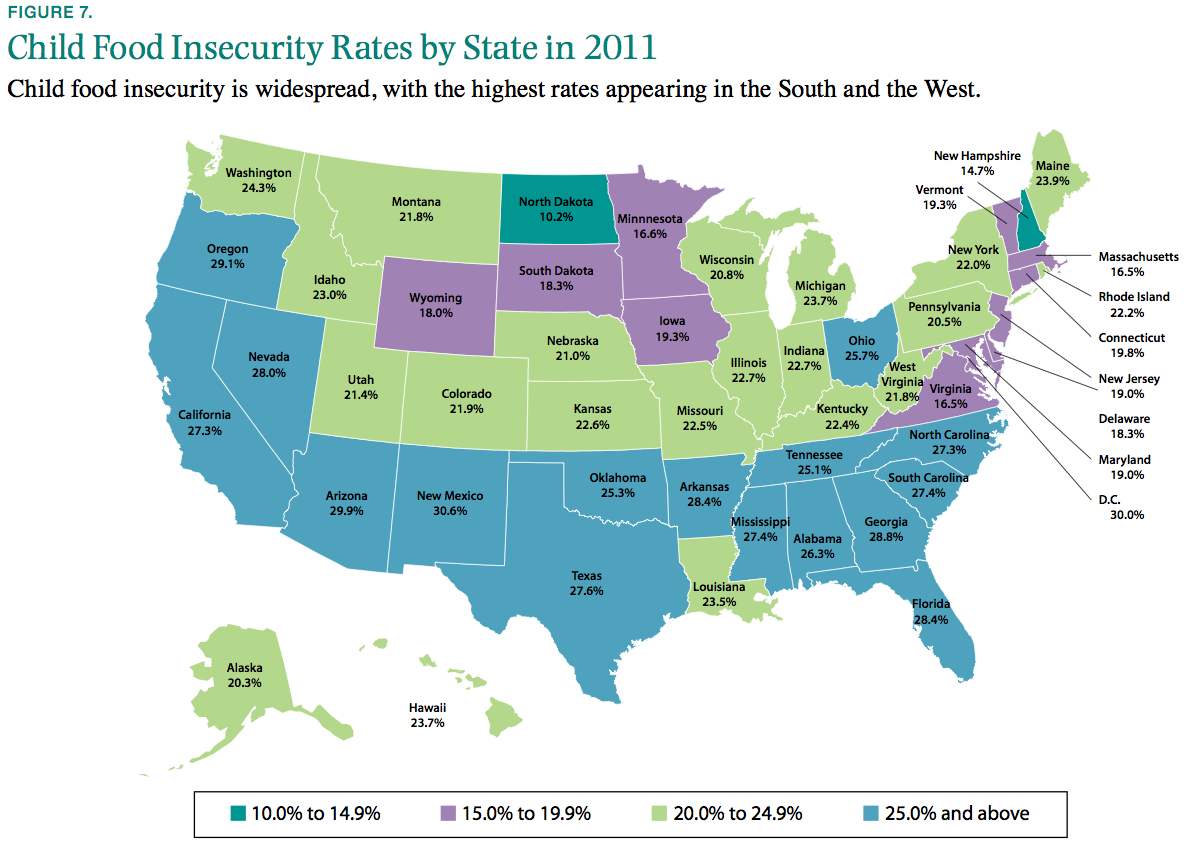
Blogs

The importance of a proper scale

Business Insider (link) highlighted a map showing childhood food insecurity across the
Read More
The inutility of stacking columns
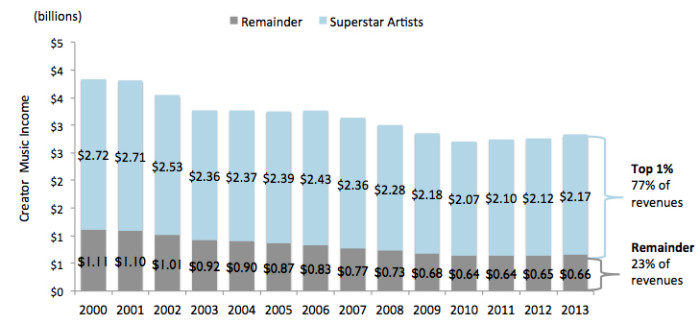
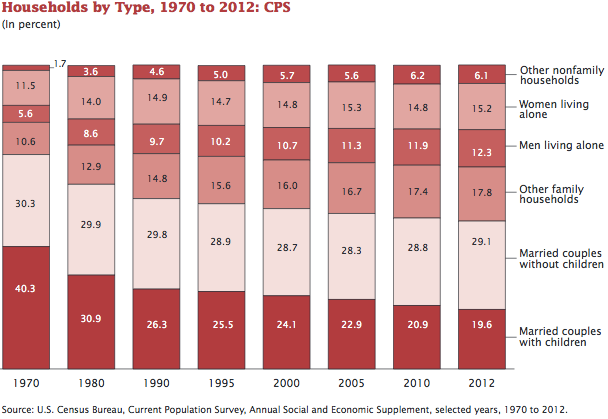
Bar chart

The inutility of stacking columns

When I see a stacked column chart like this: (via Andrew Sullivan)
Read More
De-noising data
Bar chart

De-noising data

One of the most important steps in analyzing data is to remove
Read More
Spin, spin, spin away
trifecta checkup

Spin, spin, spin away

If the data is bad, no amount of graphical magic can save it
Read More
← Newer Posts Page 12 of 19 Older Posts →
Junk Charts © 2026
  • BOOKS
  • COURSES
  • PRESS
  • CONSULTING
  • COACHING
  • CONTACT
Powered by Ghost