Junk Charts
  • About
  • RSS
  • Posts by Year
  • Posts by Keywords
Sign in Subscribe

Economist

Guide to using pairs of circles
Bubble chart

Guide to using pairs of circles

A discussion of some design decisions
Read More
Getting metrics right is half the battle
measurement

Getting metrics right is half the battle

Learning from some student projects
Read More
Students demonstrate how analytics underlie strong dataviz
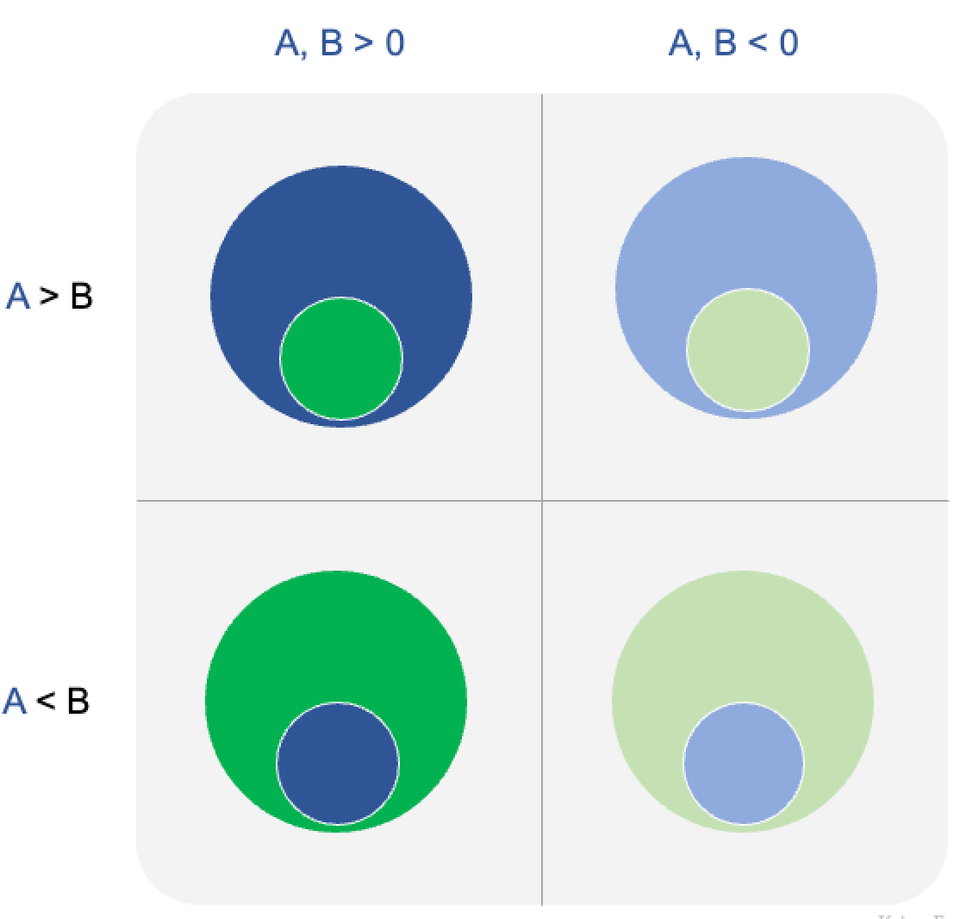
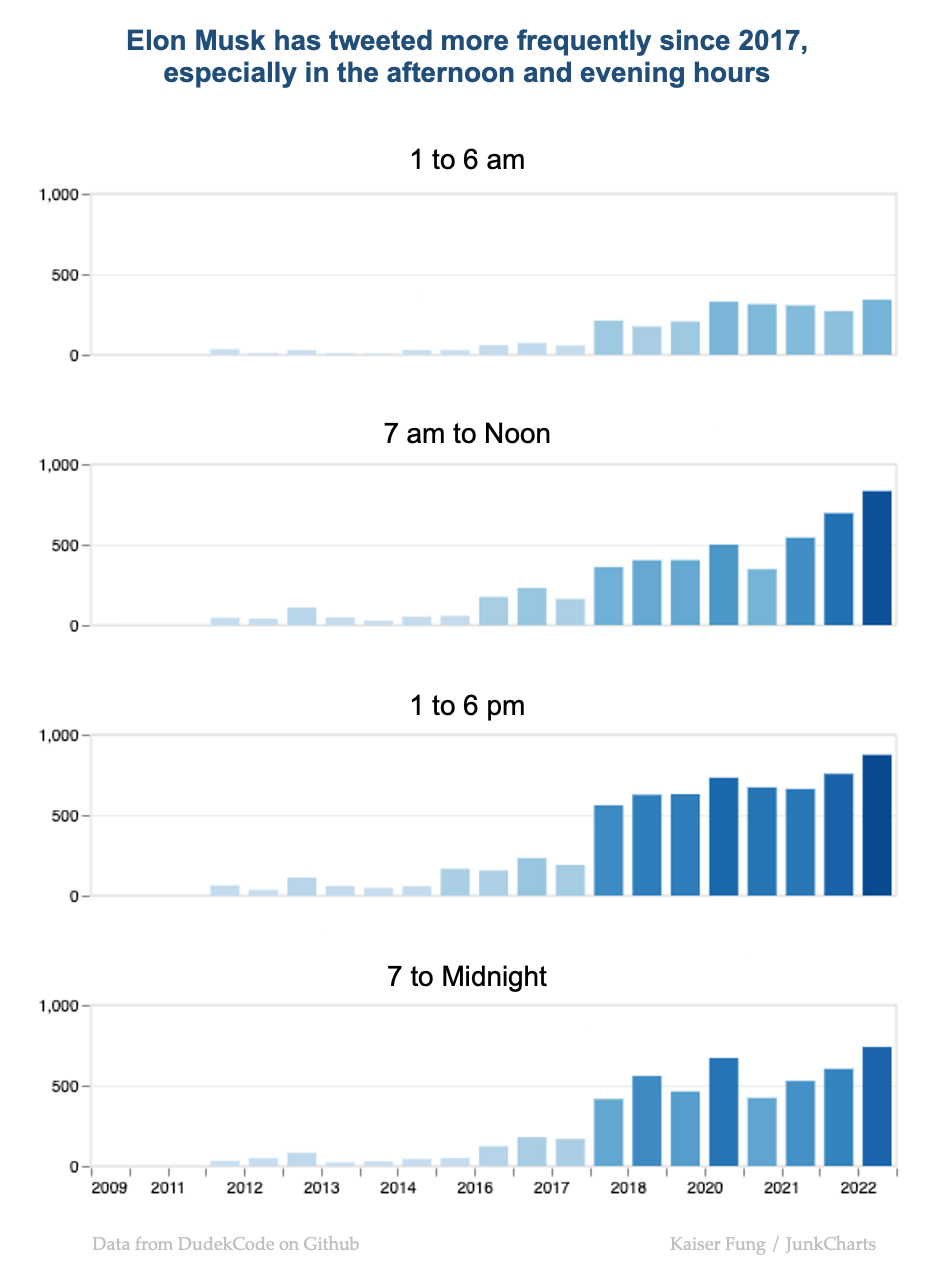
ray vella

Students demonstrate how analytics underlie strong dataviz

Students demonstrate the value of analytics to data visualization
Read More
Aligning the visual and the message
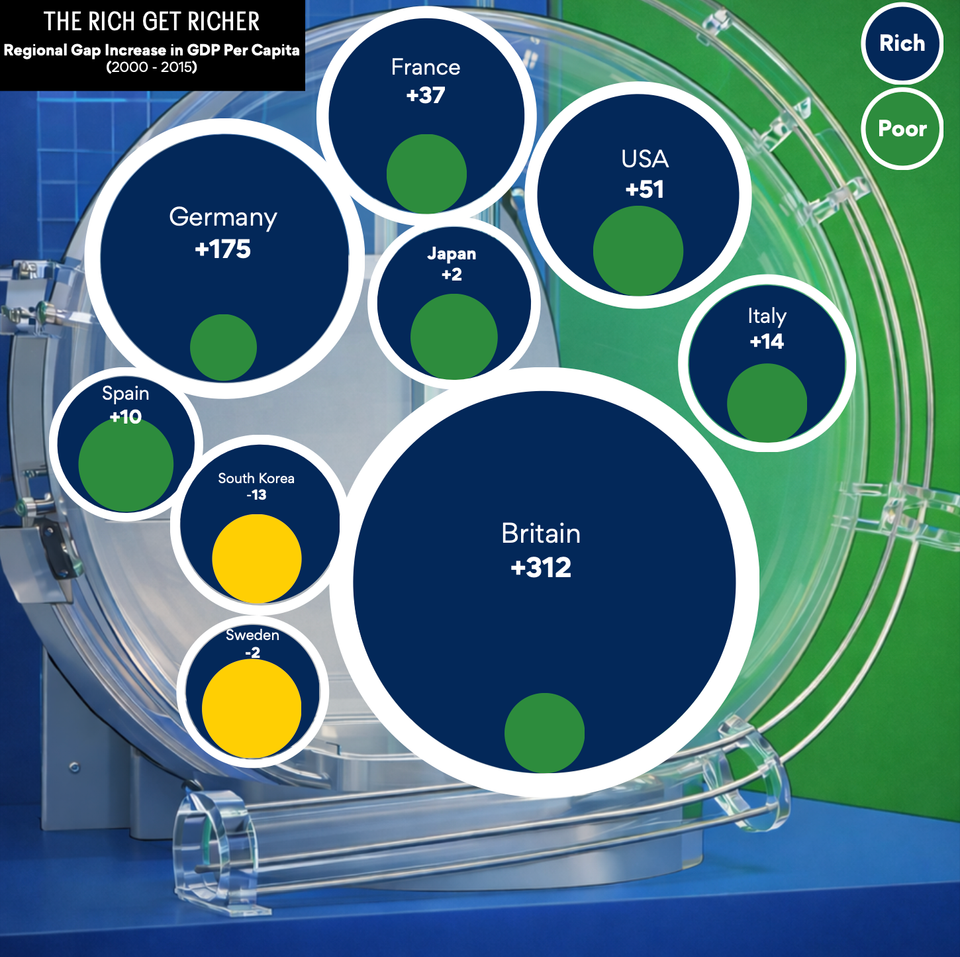
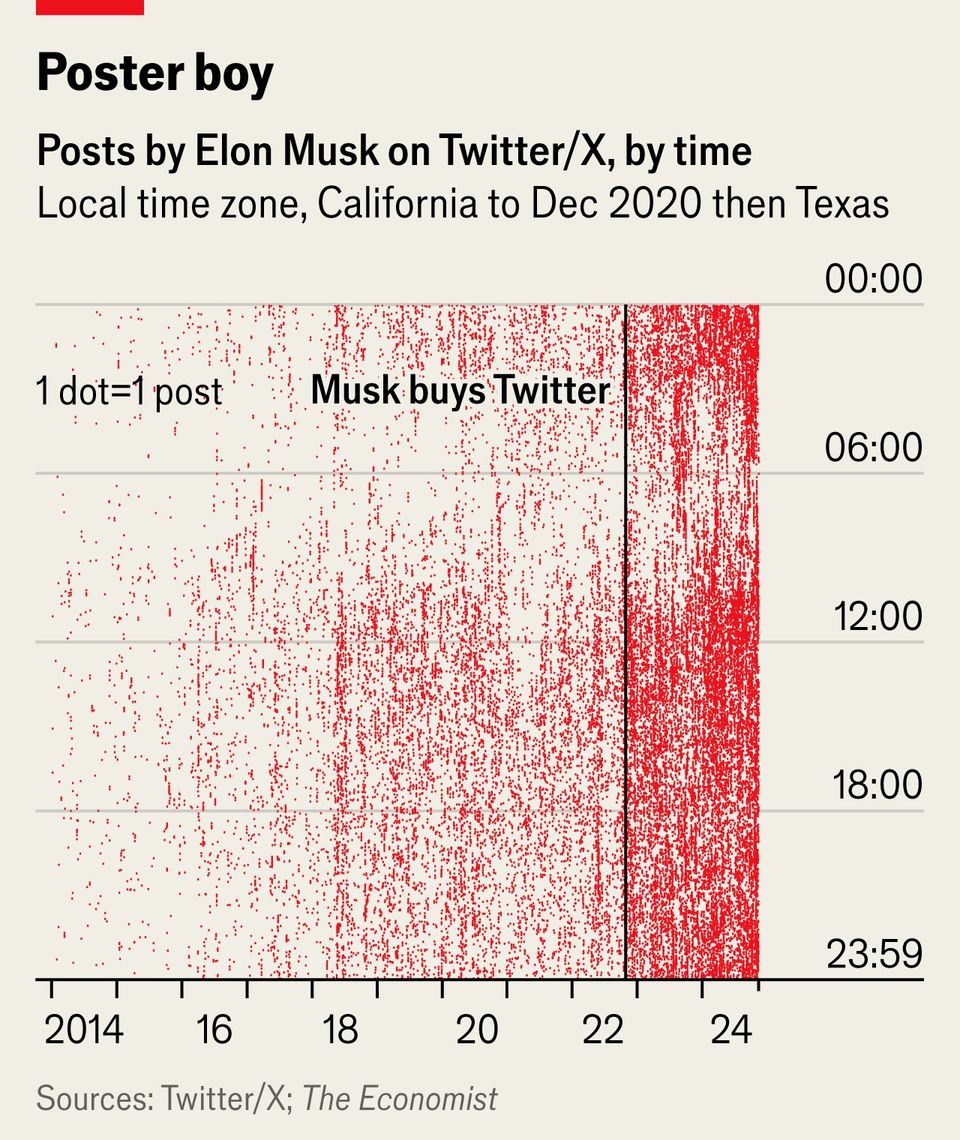
ray vella

Aligning the visual and the message

Student of Ray Vella's NYU class produces a delightful project
Read More
Organizing time-stamped data
Aggregation

Organizing time-stamped data

Re-organizing the time stamps of Elon Musk tweets
Read More
Don't show everything
Aggregation

Don't show everything

Plotting lots of data but conveying not much information
Read More
Page 1 of 4 Older Posts →
Junk Charts © 2026
  • BOOKS
  • COURSES
  • PRESS
  • CONSULTING
  • COACHING
  • CONTACT
Powered by Ghost