Junk Charts
  • About
  • RSS
  • Posts by Year
  • Posts by Keywords
Sign in Subscribe

Heatmap

Aligning the visual and the message to hot things up
Color

Aligning the visual and the message to hot things up

How hot is Phoenix
Read More
The curse of dimensions
Aggregation

The curse of dimensions

Kaiser considers some bubble maps.
Read More
Messing with expectations
Map

Messing with expectations

Kaiser reads a map of gas surcharges.
Read More
How effective visualization brings data alive
Aggregation

How effective visualization brings data alive

Bringing data alive
Read More
Some chart types are not scalable
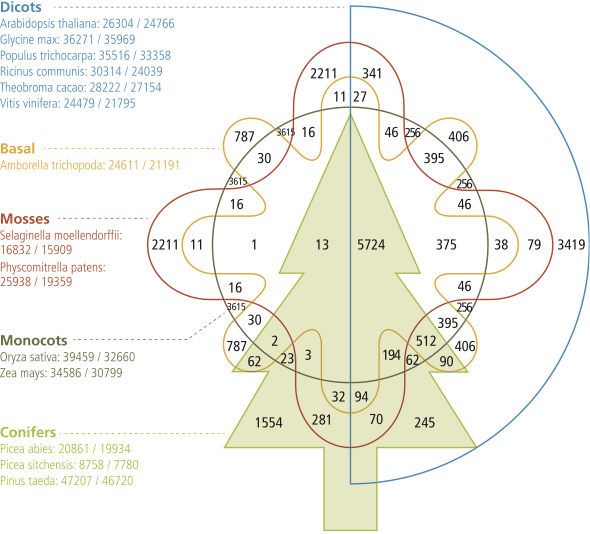
venn diagram

Some chart types are not scalable

Peter Cock sent this Venn diagram to me via twitter. (Original from
Read More
Page 1 of 1
Junk Charts © 2025
  • BOOKS
  • COURSES
  • PRESS
  • CONSULTING
  • COACHING
  • CONTACT
Powered by Ghost