Junk Charts
  • About
  • RSS
  • Posts by Year
  • Posts by Keywords
Sign in Subscribe

Hierarchy

Ranks, labels, metrics, data and alignment
Bar chart

Ranks, labels, metrics, data and alignment

A rhombus shaped chart on airline rankings
Read More
Visualizing extremes
Aggregation

Visualizing extremes

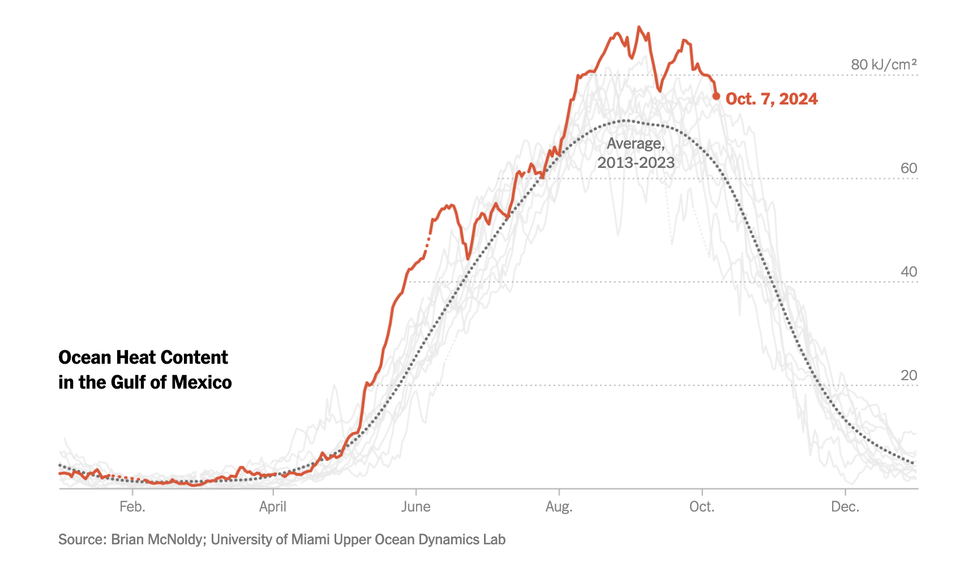
Nice NYT chart showing weather extremes
Read More
Small tweaks that make big differences
Axis

Small tweaks that make big differences

Some small tweaks to data graphics make a huge difference
Read More
Making colors and groups come alive
Bar chart

Making colors and groups come alive

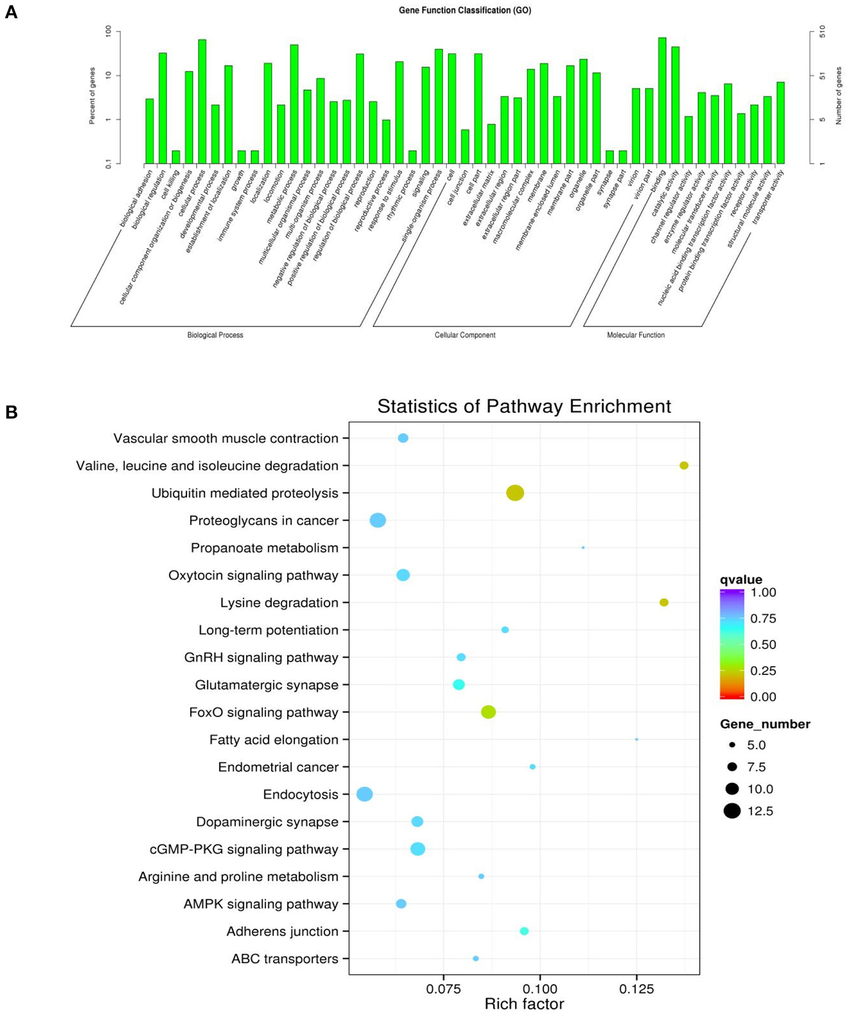
How to use color effectively in a dataviz
Read More
Do you want a taste of the new hurricane cone?
Aggregation

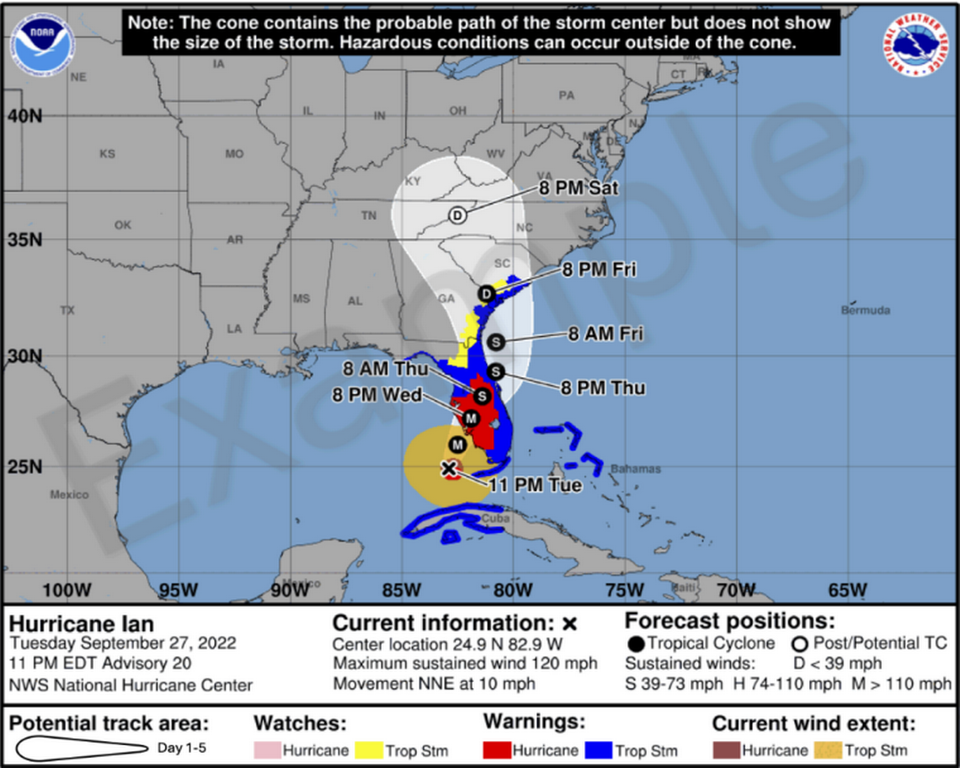
Do you want a taste of the new hurricane cone?

The National Hurricane Center (NHC) put out a press release (link to
Read More
Neither the forest nor the trees
Business

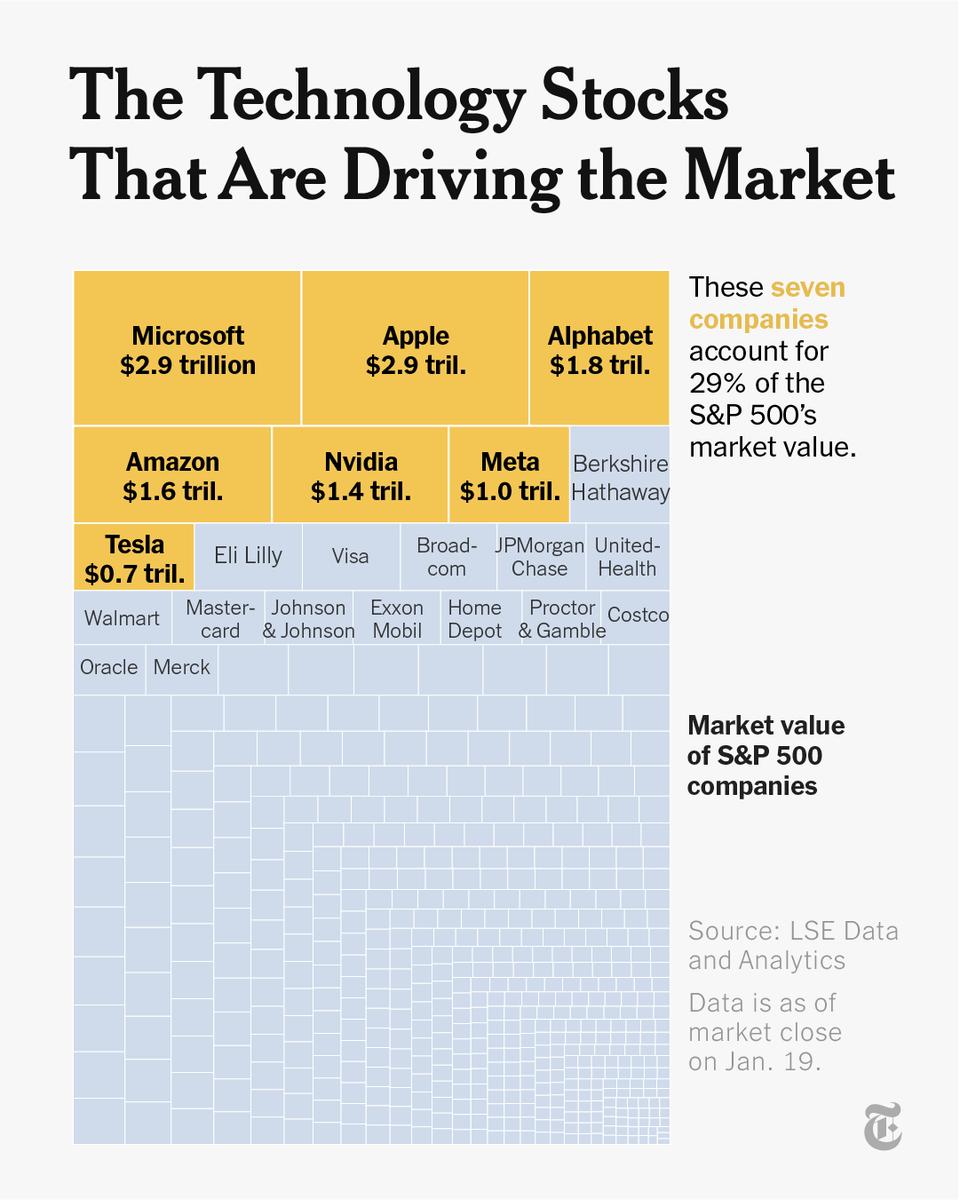
Neither the forest nor the trees

Kaiser attempts to read a treemap of stock market values.
Read More
← Newer Posts Page 2 of 3 Older Posts →
Junk Charts © 2026
  • BOOKS
  • COURSES
  • PRESS
  • CONSULTING
  • COACHING
  • CONTACT
Powered by Ghost