ray vella Two commendable student projects, showing different standards of beauty Kaiser discusses two dataviz projects by NYU students.
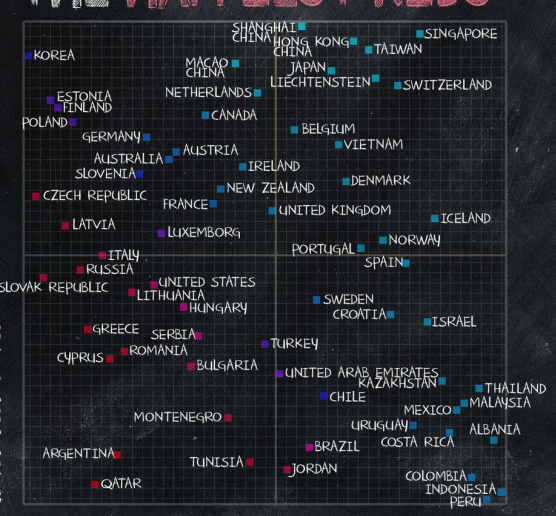
ray vella Diverging paths for rich and poor, infographically Reviewing a creative data visualization from Ray Vella's class
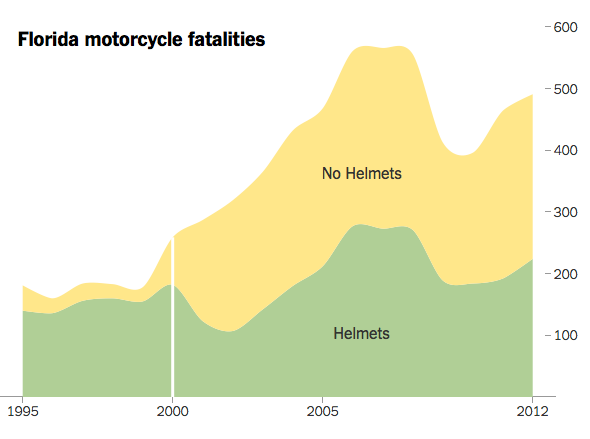
Animation A promising infographic about motorcycle helmets The New York Times graphics team shows us how to do infographics
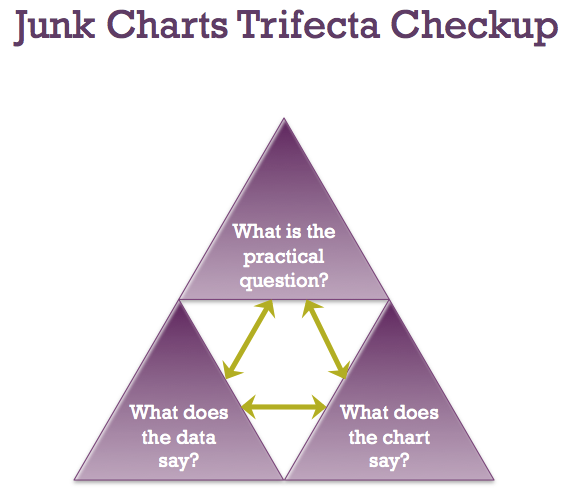
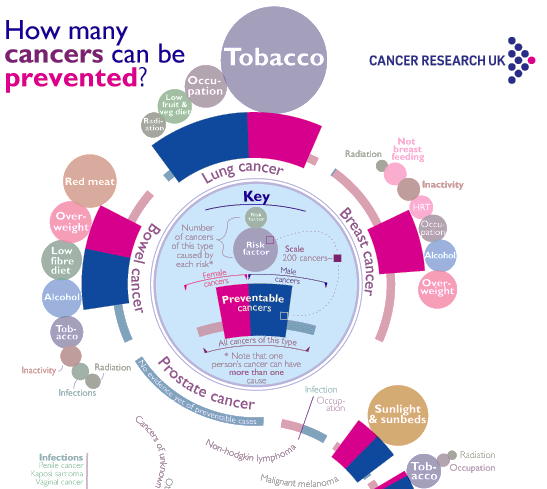
trifecta checkup Can information be beautiful when information doesn't exist? What message are you sending to your readers?