Junk Charts
  • About
  • RSS
  • Posts by Year
  • Posts by Keywords
Sign in Subscribe

junkcharts

Two challenging charts showing group distributions
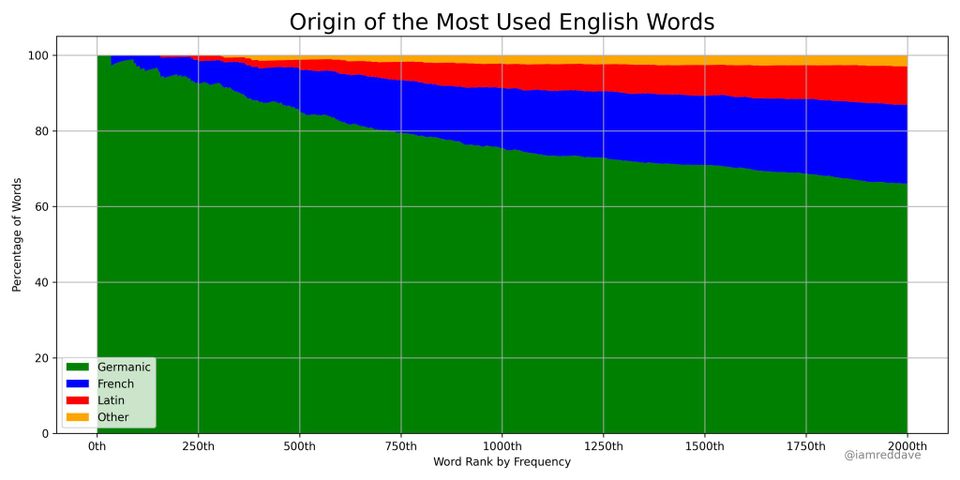
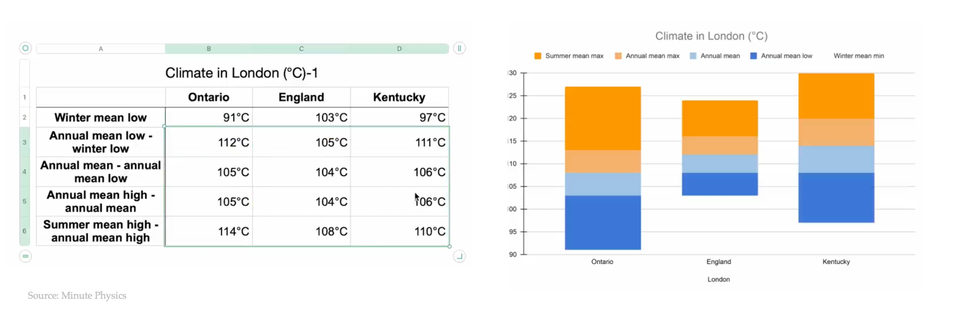
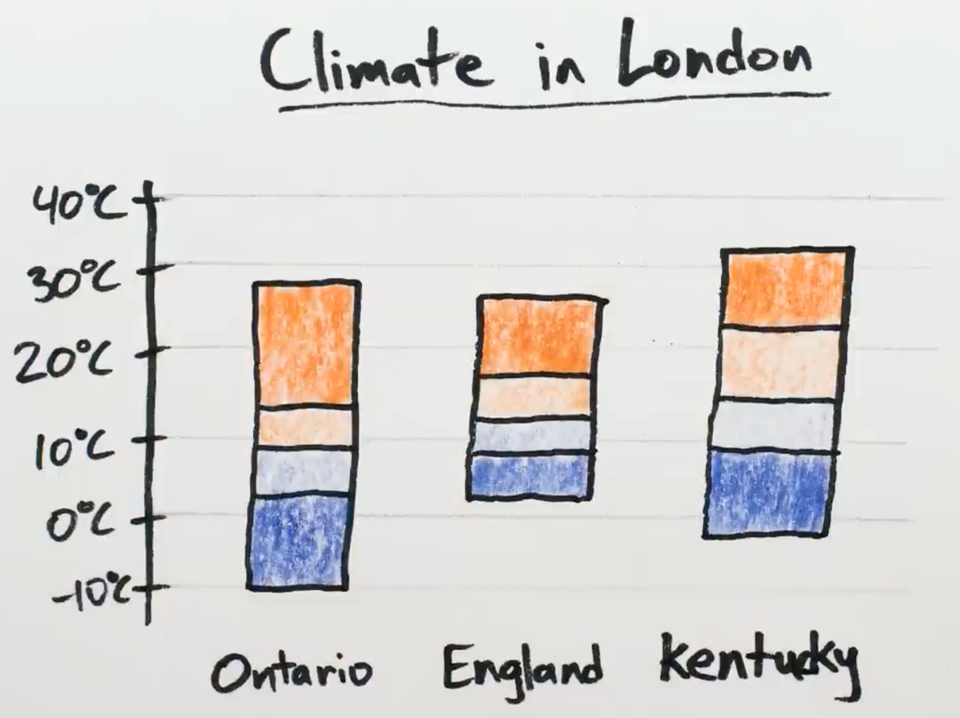
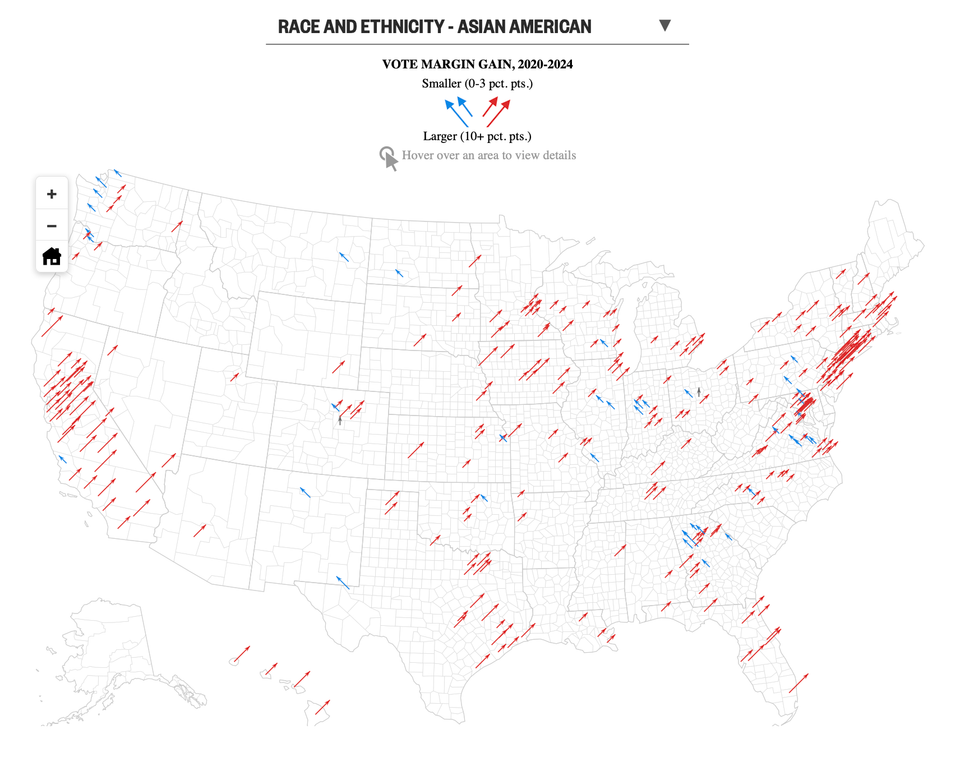
Area chart

Two challenging charts showing group distributions

Two complex charts that show subgroup distributions of data
Read More
Five-value summaries of distributions
Boxplot

Five-value summaries of distributions

Using five numbers ot summarize data distributions
Read More
What is this "stacked range chart"?
Aggregation

What is this "stacked range chart"?

Do we need this "stacked range chart"?
Read More
The canonical U.S. political map
Map

The canonical U.S. political map

What makes the canonical US elections map work?
Read More
Gaining precision by deleting data
Current affairs

Gaining precision by deleting data

How to gain precision by deleting data
Read More
Dot plots with varying dot sizes
Aggregation

Dot plots with varying dot sizes

An example of a dot plot with varying dot sizes
Read More
← Newer Posts Page 12 of 63 Older Posts →
Junk Charts © 2026
  • BOOKS
  • COURSES
  • PRESS
  • CONSULTING
  • COACHING
  • CONTACT
Powered by Ghost