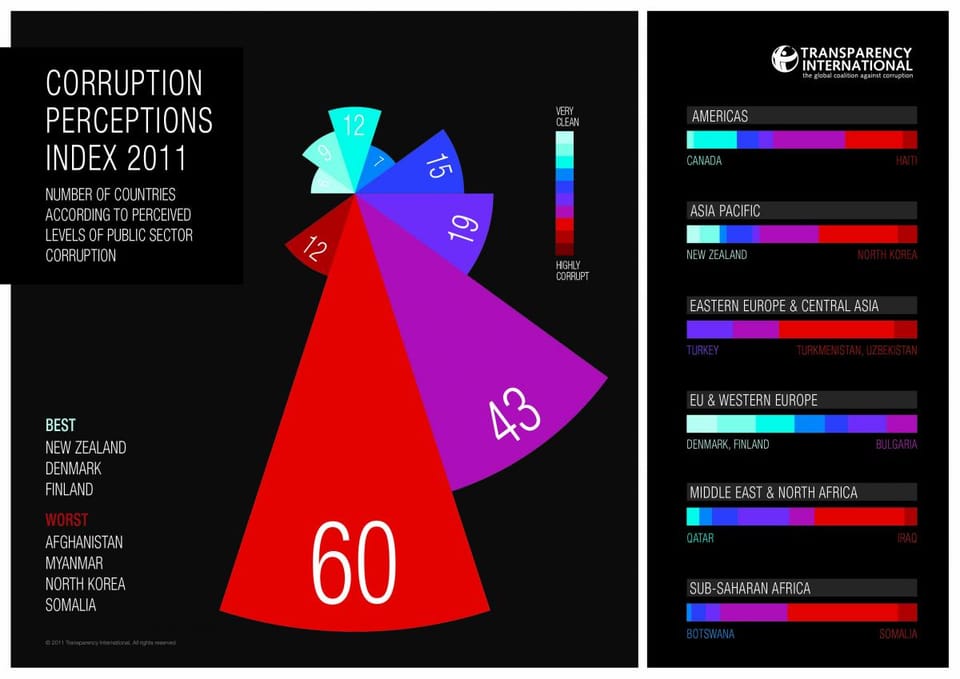
Archive: 2017 Corruption interrupted Attendess of my Copenhagen seminar this week saw an example of a
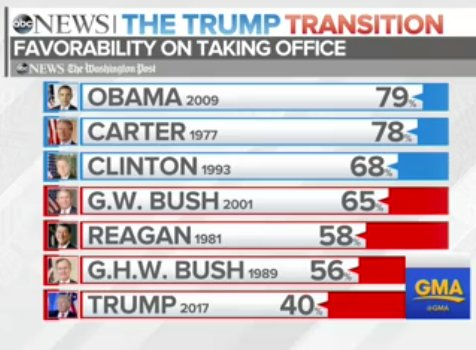
Bar chart Butcher: which part of the leg do you want? Me: All of it, in five pieces please This ABC News chart seemed to have taken over the top of
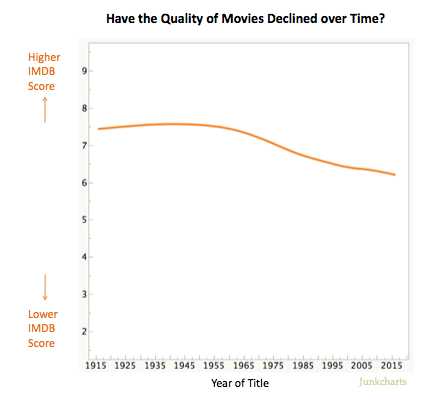
Big Data Counting is hard, especially when you don't have theories Exploring the data about movies, uncovering data issues
Algorithms Pre-processing data is not just about correcting errors Exploration of IMDB rating data, by Kaiser Fung, founder of Principal Analytics Prep
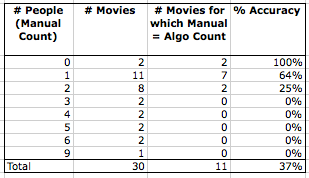
Aggregation Good models + Bad data = Bad analysis Example showing how to diagnose bad data in data science models