Aggregation Digital revolution in China: two visual takes Kaiser Fung, founder of JunkCharts and Principal Analytics Prep, discusses a map in the Economist about the digital silk road in China. What's the story?
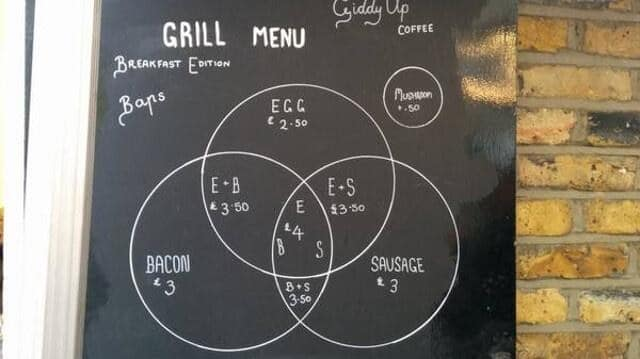
Food Foodies say, add dataviz spice please Kaiser Fung, founder of Junk Charts and Principal Analytics Prep, explains why the Venn diagram is not easy to read, and discusses some nice interesting food and beverage menus.
Pie chart Doing my duty on Pi Day #onelesspie Kaiser Fung, founder of Junk Charts and Principal Analytics Prep, celebrates Pi Day by remaking a pie chart from Wikipedia.
ray vella Diverging paths for rich and poor, infographically Reviewing a creative data visualization from Ray Vella's class
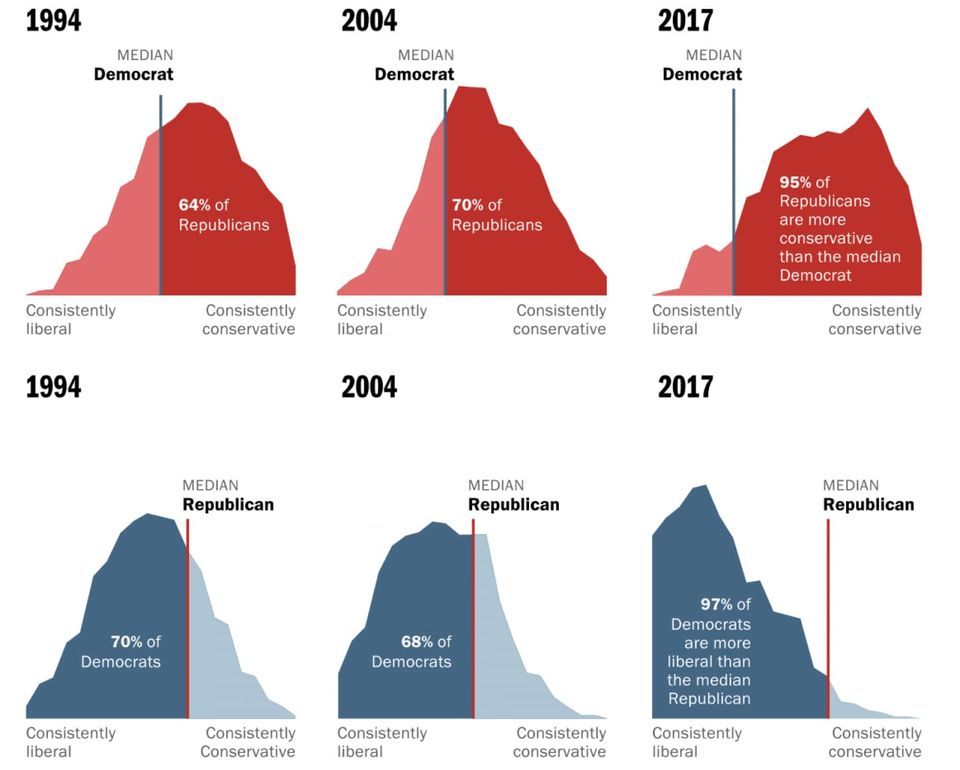
Area chart Let's not mix these polarized voters as the medians run away from one another In-depth look at Washington Post's fantastic feature on median U.S. voters
Bar chart Excel is the graveyard of charts, no! Kaiser Fung, creator of Junk Charts blog and founder of Principal Analytics Prep, encourages Excel users to work harder at making nice data graphics.