Junk Charts
  • About
  • RSS
  • Posts by Year
  • Posts by Keywords
Sign in Subscribe

junkcharts

Good models + Bad data = Bad analysis
Aggregation

Good models + Bad data = Bad analysis

Example showing how to diagnose bad data in data science models
Read More
When to use the start-at-zero rule
start-at-zero rule

When to use the start-at-zero rule

Guide to a basic graphical rule
Read More
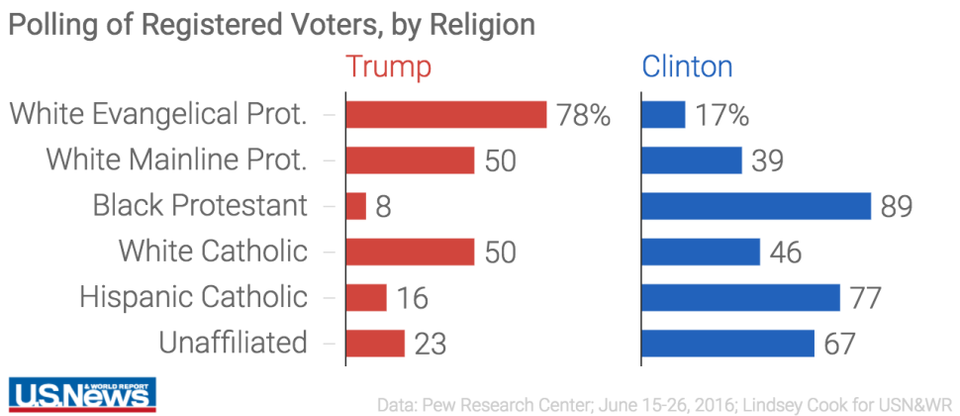
Depicting imbalance, straying from the standard chart
Aggregation

Depicting imbalance, straying from the standard chart

My friend Tonny M. sent me a tip to two pretty nice
Read More
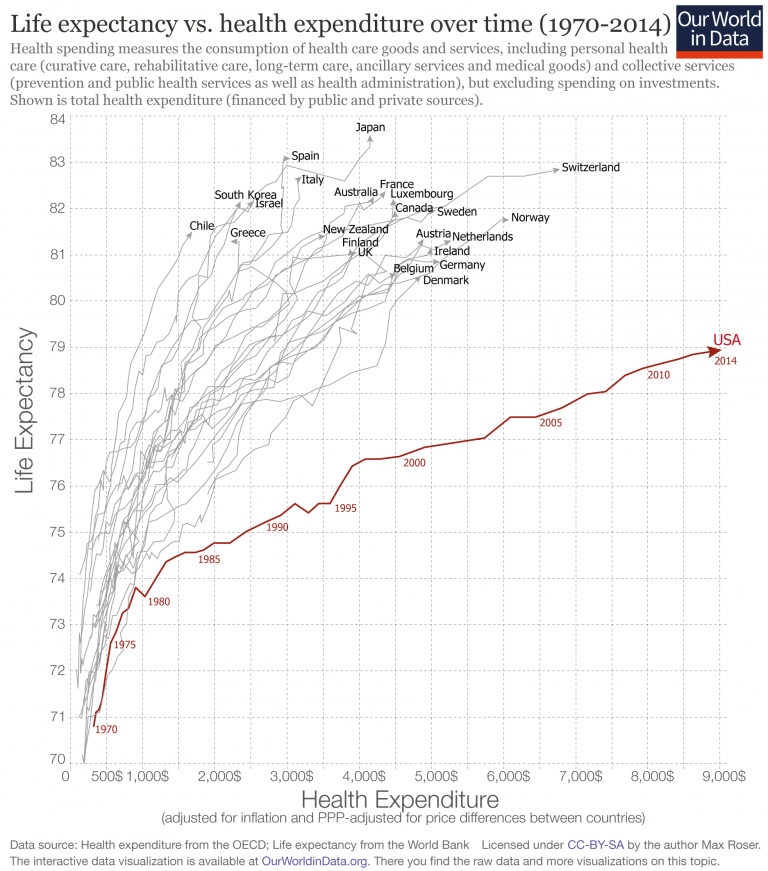
Dot plots are under-valued, that's all
Bar chart

Dot plots are under-valued, that's all

Bar charts are over-used and over-rated. Just casually, I found
Read More
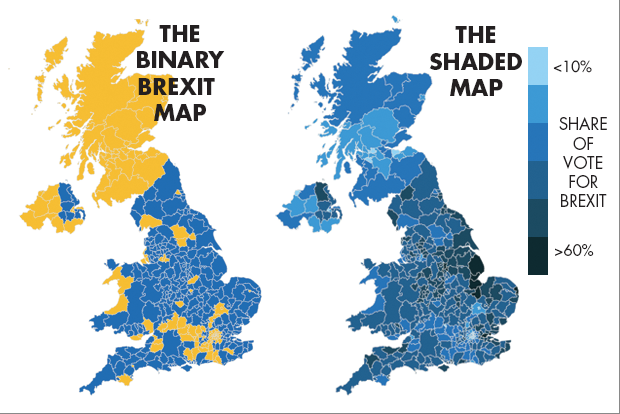
Brexit, Bremain, the world did not end so dataviz people can throw shade and color
Aggregation

Brexit, Bremain, the world did not end so dataviz people can throw shade and color

Pick your own distortion
Read More
Batmen not as interesting as it seems
Axis

Batmen not as interesting as it seems

When this post appears, I will be on my way to Seattle.
Read More
← Newer Posts Page 27 of 65 Older Posts →
Junk Charts © 2026
  • BOOKS
  • COURSES
  • PRESS
  • CONSULTING
  • COACHING
  • CONTACT
Powered by Ghost