Junk Charts
About
RSS
Posts by Year
Posts by Keywords
Sign in
Subscribe
junkcharts
Color
End of year effect?
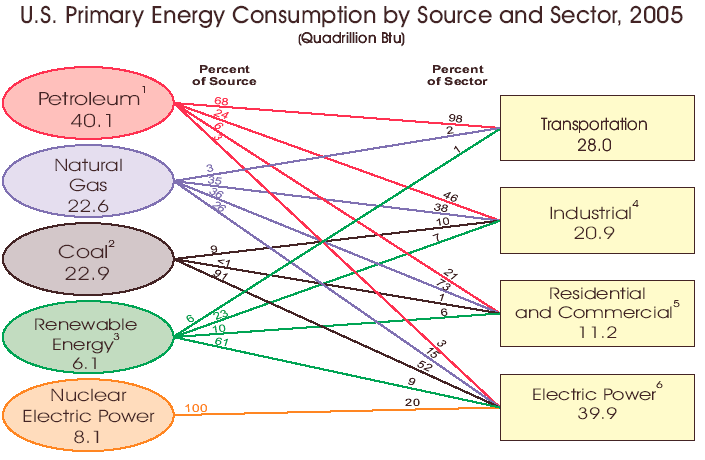
I agree with JF who suggested that this chart was mind-boggling. The
Bar chart
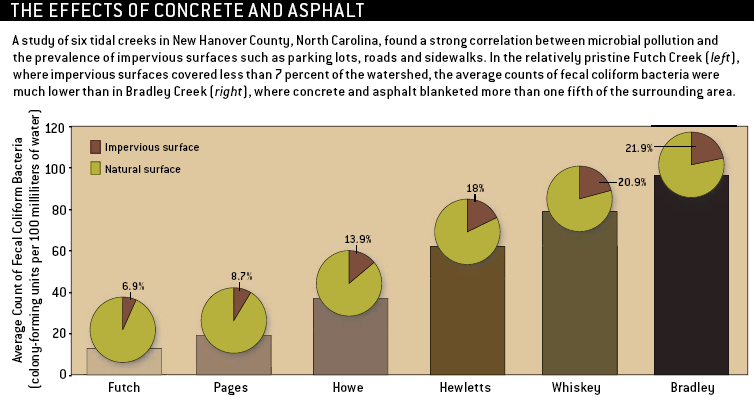
Wading in waste
A poor graphic leaves readers wading in waste, in this case, the
Blogs
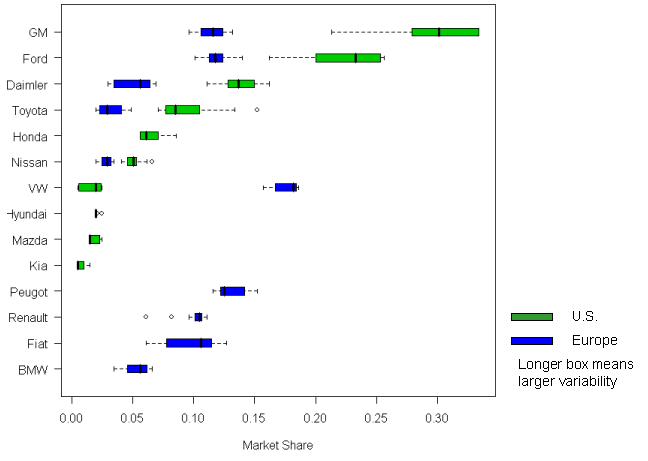
Calming the rip tide
Xan Gregg at Forth Go helpfully scraped the auto market share data
Finance
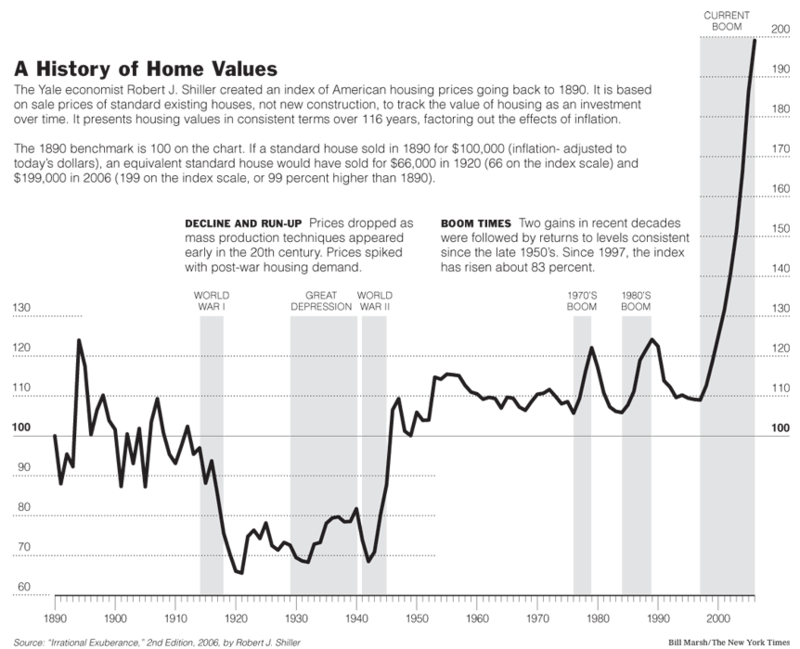
Higher, higher and higher
How high can it go? This chart, sent in by Michael McCracken
Aggregation
Graphical equity 1
I've been slow checking my email lately: several of you
Crime
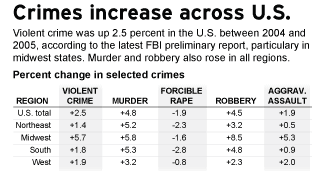
Where are the crimes?
The author of this data table and the readers are asking the
←
Newer Posts
Page 56 of 59
Older Posts
→