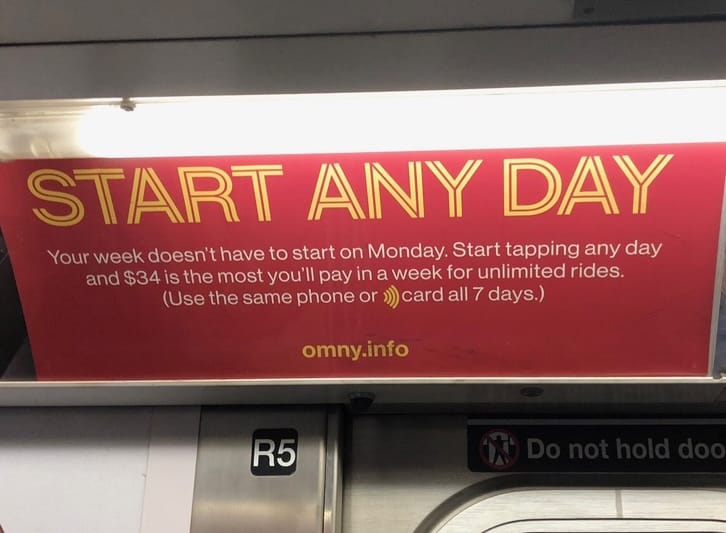
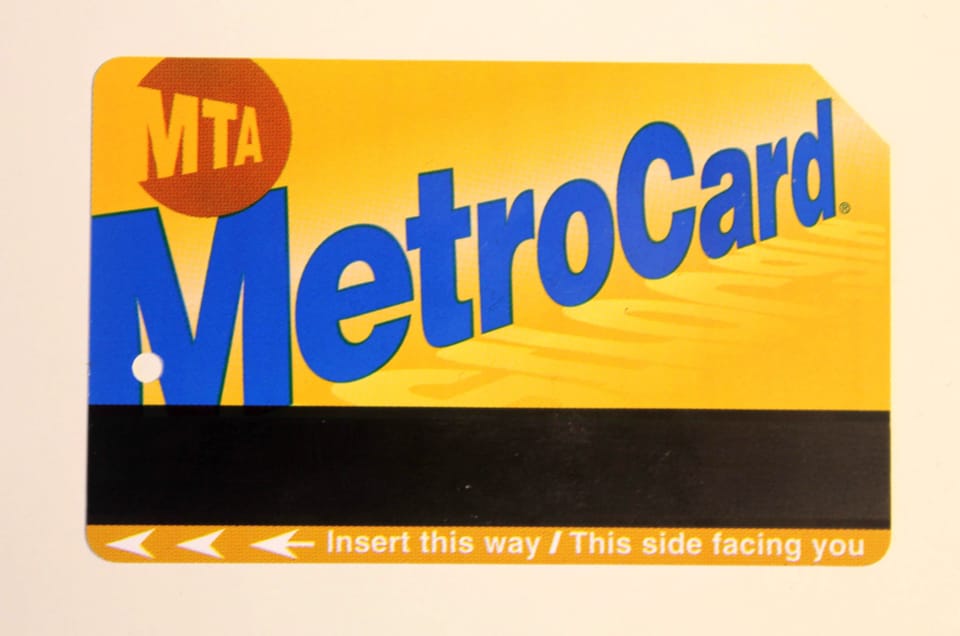
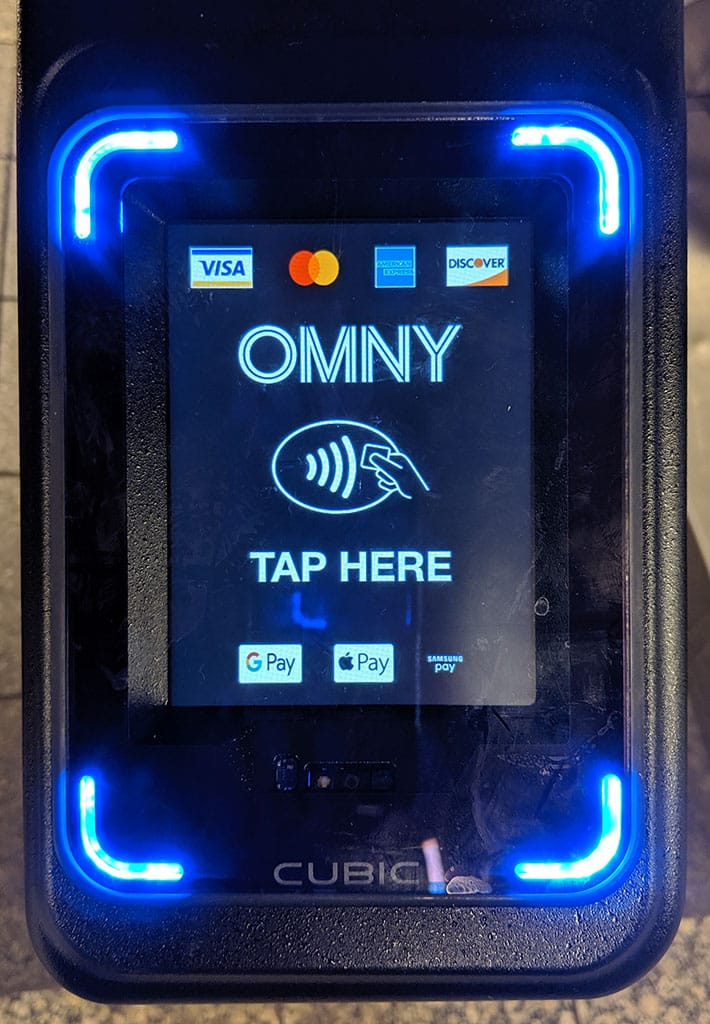
Junk Charts
  • About
  • RSS
  • Posts by Year
  • Posts by Keywords
Sign in Subscribe

kaiser fung

Color bomb
Bar chart

Color bomb

Color bomb in AI analytics
Read More
Light entertainment: Acid Images
Food

Light entertainment: Acid Images

Light entertainment: Acid Images
Read More
Students demonstrate how analytics underlie strong dataviz
NYU

Students demonstrate how analytics underlie strong dataviz

Students demonstrate the value of analytics to data visualization
Read More
Decluttering charts
Clustering

Decluttering charts

Decluttering charts
Read More
Out of line
Dot plot

Out of line

Out of line
Read More
The line-angle illusion
Area chart

The line-angle illusion

We fail to judge the distance between two lines on a chart.
Read More
← Newer Posts Page 2 of 13 Older Posts →
Junk Charts © 2025
  • BOOKS
  • COURSES
  • PRESS
  • CONSULTING
  • COACHING
  • CONTACT
Powered by Ghost