Junk Charts
  • About
  • RSS
  • Posts by Year
  • Posts by Keywords
Sign in Subscribe

Legend

Dot plots with varying dot sizes
Aggregation

Dot plots with varying dot sizes

An example of a dot plot with varying dot sizes
Read More
Aligning the visual and the message to hot things up
Color

Aligning the visual and the message to hot things up

How hot is Phoenix
Read More
Excess delay
Bar chart

Excess delay

Kaiser finds a chart that analyzes London's congestion charging programme.
Read More
Reading log: HBR's specialty bar charts
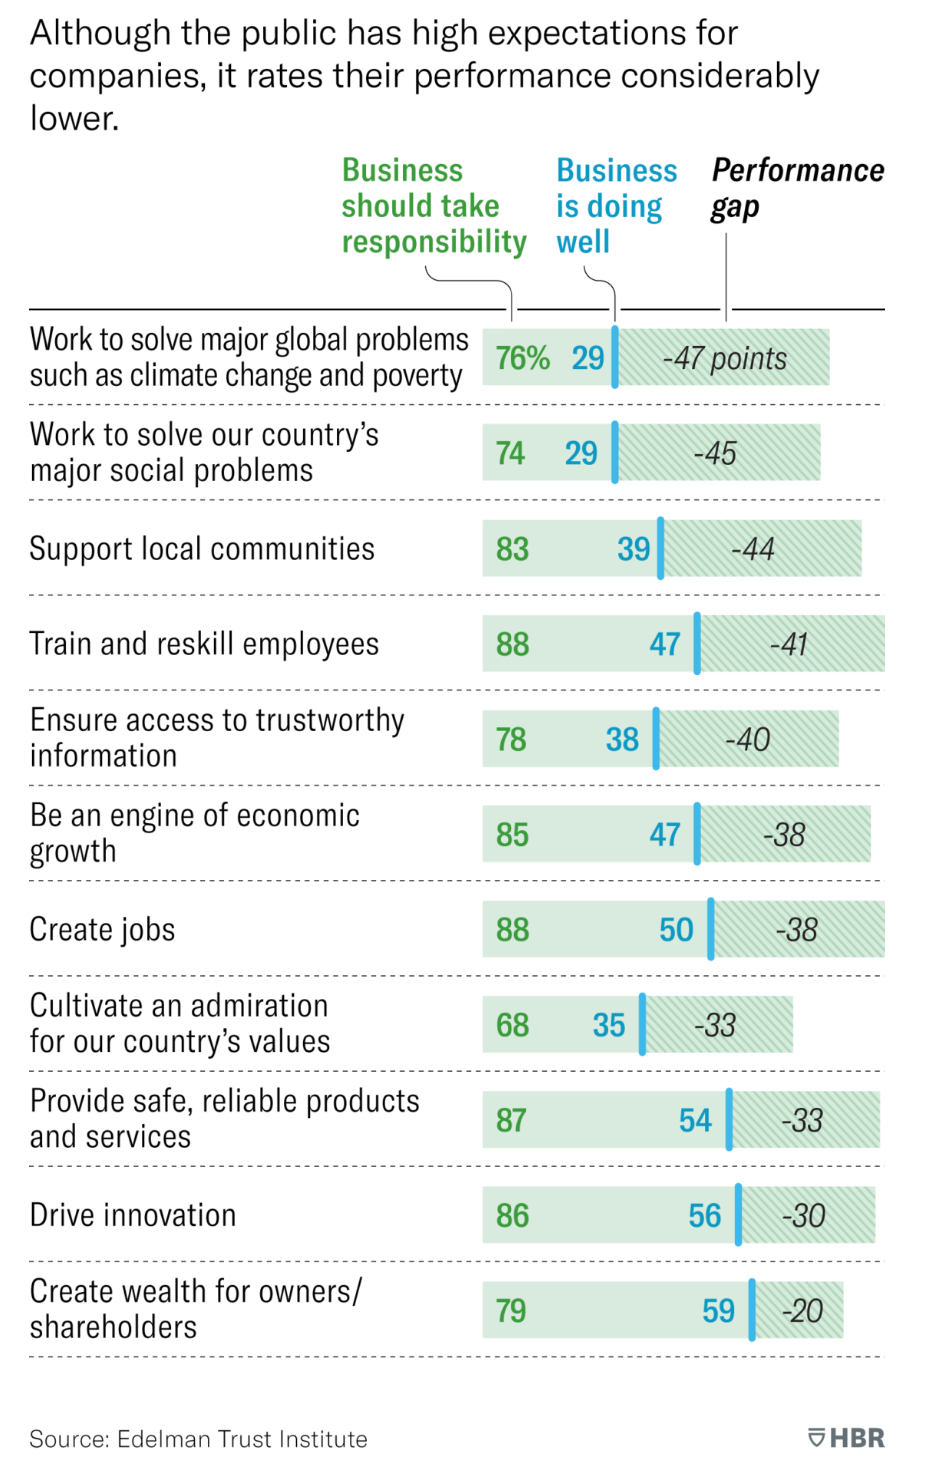
Bar chart

Reading log: HBR's specialty bar charts

Today, I want to talk about a type of analysis that I
Read More
The curse of dimensions
Aggregation

The curse of dimensions

Kaiser considers some bubble maps.
Read More
Messing with expectations
Map

Messing with expectations

Kaiser reads a map of gas surcharges.
Read More
← Newer Posts Page 3 of 6 Older Posts →
Junk Charts © 2026
  • BOOKS
  • COURSES
  • PRESS
  • CONSULTING
  • COACHING
  • CONTACT
Powered by Ghost