Junk Charts
  • About
  • RSS
  • Posts by Year
  • Posts by Keywords
Sign in Subscribe

line chart

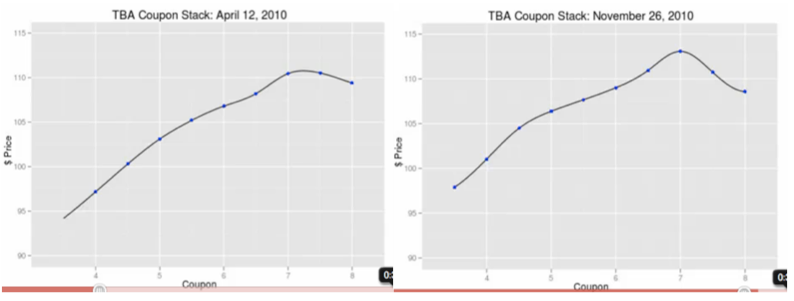
A graphlick showing mortgage prices
Business

A graphlick showing mortgage prices

The work of Hans Rosling and Gapminder (now part of Google) highlighted
Read More
What is seasonal adjustment and why is it used?
Aggregation

What is seasonal adjustment and why is it used?

Quick guide to seasonal adjustments
Read More
Pies fail to deliver
Business

Pies fail to deliver

The Wall Street Journal reported that the Ritz-Carlton brand of hotels
Read More
Stone-age graphic
Bar chart

Stone-age graphic

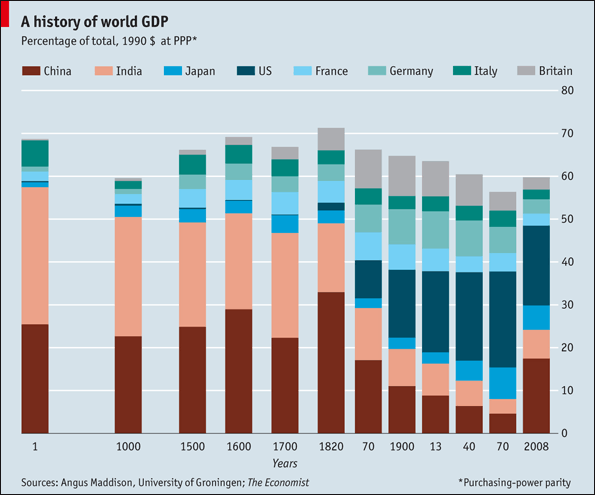
This Economist chart on the history of world GDP throws the art
Read More
Cousin misfit
Area chart

Cousin misfit

Stef, who had a hand in the inkblot charts that many loved,
Read More
Aftershocks
Axis

Aftershocks

The graphs in this BBC article comparing several recent earthquakes hit us
Read More
← Newer Posts Page 12 of 18 Older Posts →
Junk Charts © 2026
  • BOOKS
  • COURSES
  • PRESS
  • CONSULTING
  • COACHING
  • CONTACT
Powered by Ghost