Junk Charts
  • About
  • RSS
  • Posts by Year
  • Posts by Keywords
Sign in Subscribe

line chart

Visualizing web statistics
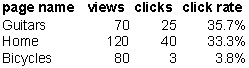
Aggregation

Visualizing web statistics

Tim inquired about: how to create an elegant graph for Web visitor
Read More
Shower of bullets
Aggregation

Shower of bullets

Here's one of those infographics that makes the reader work
Read More
Convenience charting
Axis

Convenience charting

Statisticians have long riled against "convenience sampling", that is, the
Read More
Losing count of Doomsday
Science

Losing count of Doomsday

The Doomsday Clock is making the news today: because of the  growing
Read More
Higher, higher and higher
Finance

Higher, higher and higher

How high can it go?  This chart, sent in by Michael McCracken
Read More
Where are the crimes?
Crime

Where are the crimes?

The author of this data table and the readers are asking the
Read More
← Newer Posts Page 15 of 16 Older Posts →
Junk Charts © 2025
  • BOOKS
  • COURSES
  • PRESS
  • CONSULTING
  • COACHING
  • CONTACT
Powered by Ghost