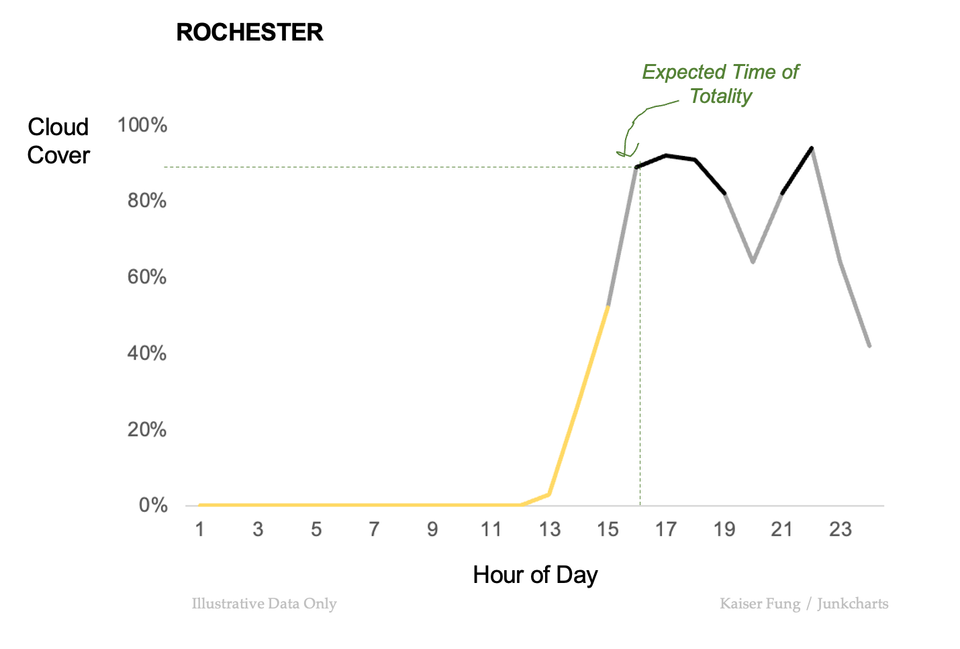
abstraction Putting the ladder of abstraction into practice Explaining complexity one piece at a time
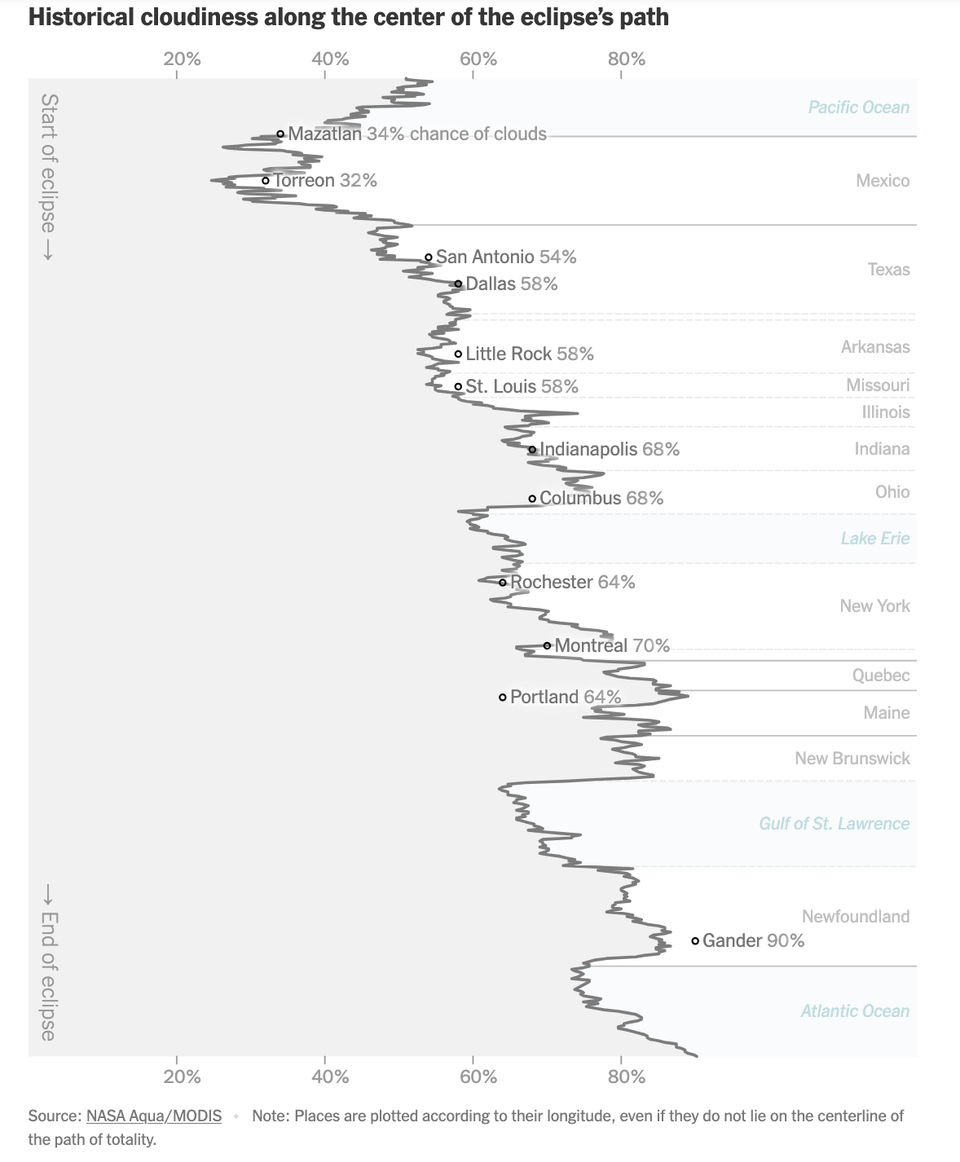
line chart An abstract chart only statisticians love The NYT made this abstract chart about clouds on full eclipse day
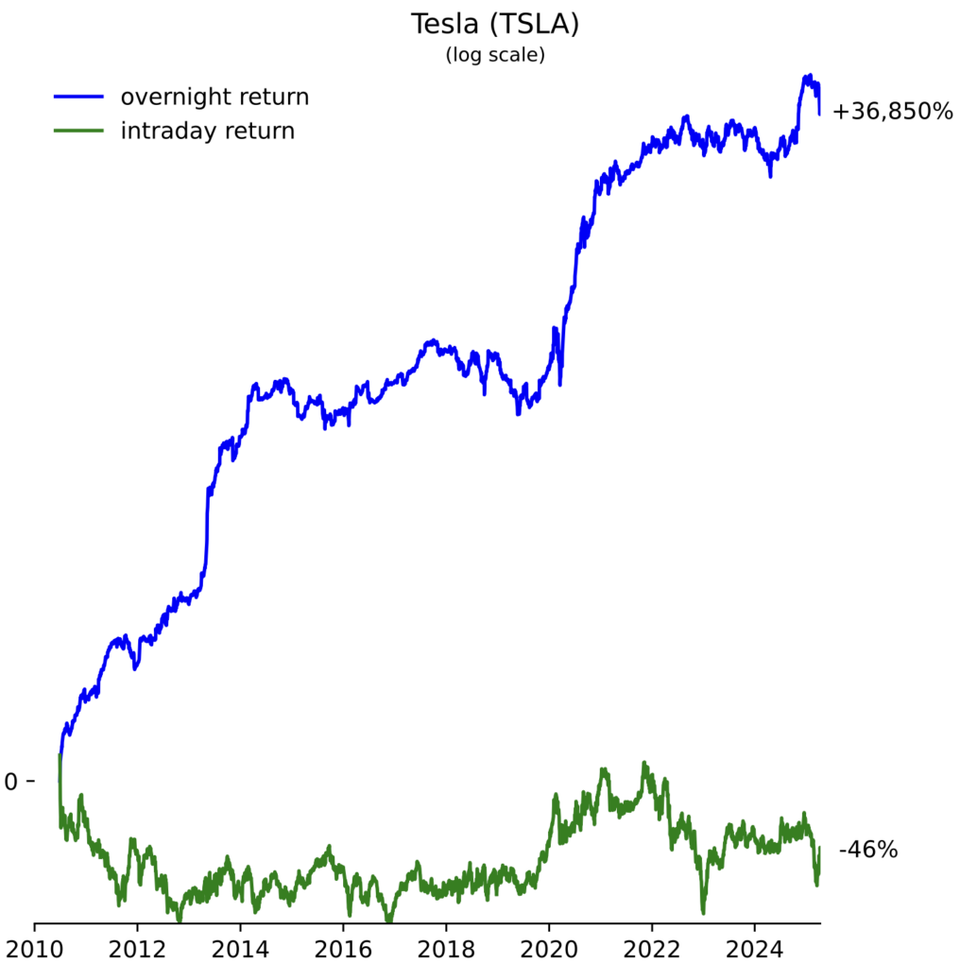
Axis On the interpretability of log-scaled charts Are log charts using original value labels more interpretable?